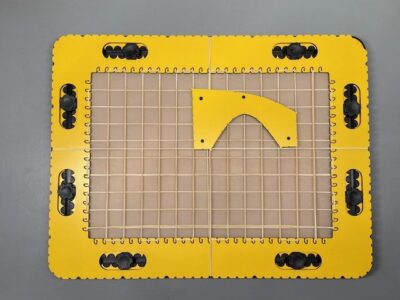
Sine graph
Photo: The first half of the sine graph has been drawn, the tool is rotated 180 degrees so the second half can be created.
Draw an X axis with the ruler. Mark the X=0 and X=180 degrees position. The distance between the two marks is eight centimetres.
Align the two two centimetre indications of the tool with the X axis.
Draw the contour line for the sine from the X value of 0. Start at the pen blocker to avoid glitches. Draw along the contour until the pen blocker at the X value of 180 degrees which is on the X axis. Hold the pen on this position and rotate the tool around this pen position so the tool is upside down. Continue drawing the second half of the tool until reaching the pen blocker again on the X axis.
For convenience place a pushpin at the 180 X position and rotate the tool around the pushpin.
You can also place pushpin(s) in the pushpin marker positions to hold the tool in place.
Cosine graph
Photo: The first quarter of the cosine graph is drawn. The tool is rotated 180 degrees clockwise, so the ‘hill’ is upside down for the negative part of the graph.
Basically the shape of the cosine has the similar shape as the sine. However the graph is shifted to the left for 90 degrees.
Draw an X axis with the ruler. Mark the 0, 90 and 180 degrees positions. A section of 90 degrees has a length of four centimetres.
Align the tool with the X axis where the right pen blocker is positioned at the 90 degrees position. Draw along the contour starting at the top (X=0) downwards to the X axis.
Rotate the tool 180 degrees clockwise. Align the tool with the X axis and draw the negative part of the graph from 90 to 270 degrees.
Rotate the tool once again. Align the tool with the X axis and draw the last quarter of the graph up from the X axis on to the top of the graph.
Tangent graph
Photo: The X and Y axis are drawn as well as the first quarter of the tangent graph. The tool is positioned so the second quarter can be created. The pen blocker is hooked with a pushpin.
Draw an X axis with the ruler. Mark the 0, 90, 180, 270 and 360 degrees positions. The distance between each position is four centimetres, which covers 90 degrees.
Draw two asymptote lines : One at 90 degrees and one at 270 degrees.
The distance for the first asymptote line is four centimetres from the 0 degrees position on the X axis, the next one is at a 12 centimetres distance.
For the first section of the graph align the short (four centimetres) side with the X axis. Start at the pen blocker (0 degrees) and draw along the tangent contour upwards until you approach the first Y axis.
For the second section of the graph find the 180 degrees position (preferably provided with a pushpin).
Hook the pen blocker with the pushpin while the tangent curve is pointing down. Align the tool with X axis and draw the lower part of the graph.
For the third section rotate the tool around the pushpin 180 degrees counter clockwise. The tool has the same position as for the first section.
The fourth section is similar to the second section. Find the 360 degrees position, hook the pen blocker to the pushpin and align the tool with the X axis and draw the curve going down unstill you approach the Y axis.


 This is the first section

 Table of content