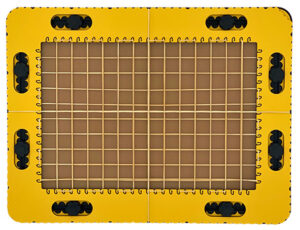
The easiest way to draw a graph is to draw the x- and y-axis first, using the ruler and measurement indications on the TactiPad, and then place the GraphGrid on the drawing board. The axes, the higher rubber bands, can now coincide with the axes drawn on the paper. You can then easily count and draw the x- and y-values of the graph along the flexible grid lines.
Because the grid lines are flexible, the graph values can be drawn exactly at the intersections by pulling the bands aside with the pen.
Once you have marked all the coordinates of the graph, you can remove the frame and create the graph by connecting the points. If you want to create multiple graphs in the same coordinate system, it is recommended to finish one graph before starting the next to avoid confusion between the two sets of coordinates.
 Previous section

 Table of content