array(
'next' => 'Next section',
'prev' => 'Previous section',
'next_default' => 'This is the last section',
'prev_default' => 'This is the first section'
),
'it' => array(
'next' => 'Sezione successiva',
'prev' => 'Sezione precedente',
'next_default' => 'Questa è l\'ultima sezione',
'prev_default' => 'Questa è la prima sezione'
)
);
$labels = isset($labels[$lang]) ? $labels[$lang] : $labels['en'];
// Haal posts op in dezelfde categorie, tag en taal
$args = array(
'posts_per_page' => -1,
'post_type' => 'post',
'orderby' => 'title',
'order' => 'ASC',
'tag_slug__in' => $tag_slugs,
'category__in' => wp_get_post_categories($post->ID),
'post_status' => 'publish',
'suppress_filters' => false, // WPML filter toepassen
'lang' => $lang // WPML taalfilter
);
$posts = get_posts($args);
if(empty($posts)) return;
// Vind index van huidige post
$current_index = null;
foreach($posts as $i => $p) {
if($p->ID == $post->ID) {
$current_index = $i;
break;
}
}
if($current_index === null) return;
// Bepaal next/previous post
if($direction === 'next') {
$target_index = $current_index + 1;
$text = ($target_index < count($posts)) ? $labels['next'] : $labels['next_default'];
} else {
$target_index = $current_index - 1;
$text = ($target_index >= 0) ? $labels['prev'] : $labels['prev_default'];
}
$link = ($target_index >= 0 && $target_index < count($posts)) ? get_permalink($posts[$target_index]->ID) : '#';
$icon_position = ($direction === 'prev') ? 'before' : 'after';
echo '
';
}
/**
* Functie: Back to manual links met WPML en meertalige labels
*/
function back_to_manual_link($page_id, $img_url, $labels) {
$lang = defined('ICL_LANGUAGE_CODE') ? ICL_LANGUAGE_CODE : 'en';
$text = isset($labels[$lang]) ? $labels[$lang] : $labels['en'];
if(function_exists('icl_object_id')) {
$translated_id = apply_filters('wpml_object_id', $page_id, 'page', true);
} else {
$translated_id = $page_id;
}
$link = get_permalink($translated_id);
echo '
';
}
// --- Next/Previous links ---
if(has_tag(array('manual-en-2','manuale-it'))) {
manual_navigation_by_title('prev', array('manual-en-2','manuale-it'), 'https://thinkable.nl/wp-content/uploads/2018/09/previous.png');
manual_navigation_by_title('next', array('manual-en-2','manuale-it'), 'https://thinkable.nl/wp-content/uploads/2018/09/next.png');
}
// --- Back to manual links ---
$manual_links = array(
'tvmanualsection-en' => array(
'page_id' => 1515,
'img' => 'https://thinkable.nl/wp-content/uploads/2018/09/up.png',
'labels' => array(
'en' => 'Return to TactileView manual overview',
'it' => 'Torna al manuale TactileView'
)
),
'tpmanualsection-en' => array(
'page_id' => 1996,
'img' => 'https://thinkable.nl/wp-content/uploads/2018/09/up.png',
'labels' => array(
'en' => 'Return to TactiPad manual overview',
'it' => 'Torna al manuale TactiPad'
)
),
'manuale-it' => array(
'page_id' => 1996,
'img' => 'https://thinkable.nl/wp-content/uploads/2018/09/up.png',
'labels' => array(
'en' => 'Return to TactiPad manual overview',
'it' => 'Torna al manuale TactiPad'
)
),
'circleframe-en' => array(
'url' => 'https://thinkable.nl/tactipad/circleframe-manual',
'img' => 'https://thinkable.nl/wp-content/uploads/2018/09/up.png',
'labels' => array(
'en' => 'Return to CircleFrame manual overview',
'it' => 'Torna al manuale CircleFrame'
)
),
'graphgrid-en' => array(
'url' => 'https://thinkable.nl/tactipad/graphgrid-manual',
'img' => 'https://thinkable.nl/wp-content/uploads/2018/09/up.png',
'labels' => array(
'en' => 'Return to GraphGrid manual overview',
'it' => 'Torna al manuale GraphGrid'
)
),
'graphgrid-manual-en' => array(
'url' => 'https://thinkable.nl/tactipad/graphgrid-manual',
'img' => 'https://thinkable.nl/wp-content/uploads/2018/09/up.png',
'labels' => array(
'en' => 'Return to GraphGrid manual overview',
'it' => 'Torna al manuale GraphGrid'
)
),
'graphgrid-tools-en' => array(
'url' => 'https://thinkable.nl/tactipad/graphgrid/',
'img' => 'https://thinkable.nl/wp-content/uploads/2018/09/up.png',
'labels' => array(
'en' => 'Return to GraphGrid overview',
'it' => 'Torna alla panoramica GraphGrid'
)
),
'tactiforma' => array(
'url' => 'https://thinkable.nl/tactiforma-manual-overview/',
'img' => 'https://thinkable.nl/wp-content/uploads/2018/09/up.png',
'labels' => array(
'en' => 'Return to Tactiforma overview',
'it' => 'Torna alla panoramica Tactiforma'
)
),
'mdamanualsection-en' => array(
'page_id' => 4284,
'img' => 'https://thinkable.nl/wp-content/uploads/2018/09/up.png',
'labels' => array(
'en' => 'Return to MDA manual overview',
'it' => 'Torna al manuale MDA'
)
),
);
foreach($manual_links as $tag => $data) {
if(has_tag($tag) || has_category($tag)) {
if(isset($data['page_id'])) {
back_to_manual_link($data['page_id'], $data['img'], $data['labels']);
} elseif(isset($data['url'])) {
$text = isset($data['labels'][$lang]) ? $data['labels'][$lang] : $data['labels']['en'];
echo '
';
}
}
}
?>
Photo: Hyperbole 1/X tool om TactiPad.
Global description
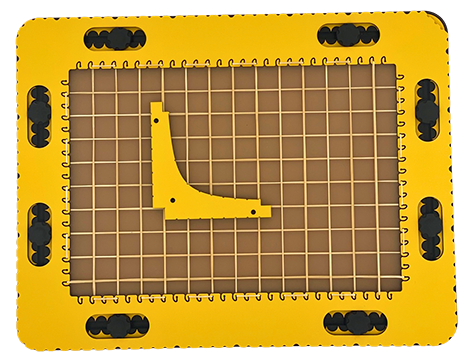
The hyperbole represents the function 1 divided by X (1/x). The tool is L-shaped. Both parts of the L have a length of 10 centimetres. The inner corner of the tool is curved. By nature of the formula, the tails of the tool become very thin. To maintain the sturdiness of the tool, additional material has been added. For alignment purposes, a small square is left out at the lower left corner of the tool (X=0 and Y=0). As well as near the endings of the curve a flat section is provided. The graph contour endings are equipped with a pen blocker. Pushpin markers are provided at the top surface.
To description section To manual section
Detailed description
The formula represented in this tool is a smooth curve only going down, seen fromm X equals 0 to X equals 8. Along the curve small indents are provided to indicate Y values corresponding with X values equal 0,25, 0,50, 1, 2, 3, 4, 5, 6, 7 and 8 respectively.
Hyperbole manual
To description section
Draw an X and Y axis with the ruler
For convenience place a pushpin in the crossing of the X and Y axis. When positioning the tool, be aware, the additional material covers the X and Y axis. Therefore, align the tool with the two axis by placing the flat sections at the tails with the axis. Draw along the contour of the tool. Rotate the tool 180 degrees clockwise. Align the tool with the axes and draw the second part of the graph.