Global description
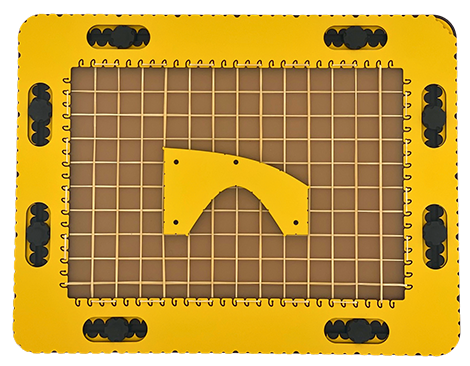
The SinTang tool combines graphs for three functions; the sin(X), the cos(X) and the tan(X). More precise, it contains half a period of the sine graph and a quarter of the tangent graph.
The sine graph, is the ‘hill’-shaped contour, representing the first half period of the sine function. The cosine graph is the for 90 degrees shifted to the left sine graph.
When placing the tool looking at the hill facing upwards, the top side of the tool forms a slope descending from left to right. After rotating the tool 90 degrees clockwise, it represents a quarter of the tangent graph.
The vertical left and right-hand sides have an indented centimetre indications. Pushpin markers are provided at the top surface. For sine and tangent values of 1, the distance along the Y-axis is four centimetres. These dimensions provide sufficient ‘tactile space’.
To description section
To manual section
Detailed description of the sine tool
The range from 0 to 180 degrees (X-values) is distributed over a length of eight centimetres (aprox. 3 inches). At 90 degrees, the graph reaches its maximum amplitude at a height of four centimetres.
Small indents are provided in the curve at 30, 45, 60, 90, 120, 135, and 150 degrees. Pen blockers are provided at 0- and 180-degrees positions.
Detailed description of the tangent tool
The tangent part of the tool has to be rotated for 90 degrees clockwise and counter-clockwise for use.
The contour of the tangent includes small indents indicating the 30-, 45- and 60-degree positions on the X-axis. The tan(45°) equals 1; the corresponding height of the graph is four centimetres. Pen blockers are provided at the 0-degree position and near the 90-degree position.
A length of four centimetres along the X-axis represents a range of 90 degrees.
SinTang manual
Sine graph
- Draw an X-axis with the ruler. Mark the 0- and 180-degrees positions. The distance between the two marks is eight centimetres.
- Align the sides with the two-centimetre indications of the tool with the X-axis.
- Draw the contour line for the sine from at X = 0.
- Keep the pen blocker to avoid glitches. Draw along the contour until the pen blocker at the X value of 180 degrees which is on the X axis.
- Keep the pen on this position and rotate the tool around this pen position so the tool is upside down.
- Continue drawing the second half of the sine graph until reaching the pen blocker again on the X-axis.
- For convenience, place a pushpin at the 180-degree position first and rotate the tool around the pushpin.
- You can also place pushpins in the pushpin in the designated markers to hold the tool in position.
Cosine graph
Basically the shape of the cosine has the similar shape as the sine. However the graph is shifted to the left for 90 degrees.
- Draw an X axis with the ruler. Mark the 0-, 90- and 180-degrees positions. A section of 90 degrees has a length of four centimetres.
- Align the tool with the X-axis where the right pen blocker is positioned at the 90-degrees position.
- Draw along the contour starting at the top (X = 0) and move downwards to the X-axis.
- Rotate the tool 180 degrees clockwise. Align the tool with the X-axis and draw the negative part of the graph from 90 to 270 degrees.
- Rotate the tool once more. Align it with the X-axis and draw the last quarter of the graph up from the X-axis on to the top of the graph.
Tangent graph
- Draw an X-axis with the ruler. Mark the 0- 90- 180- 270- and 360-degrees positions. The distance between each position is four centimetres representing 90 degrees.
- Draw two asymptote lines: One at 90 degrees and one at 270 degrees.
- The first asymptote is located four centimetres from the 0-degree position on the X-axis; the second is located twelve centimetres from the 0-degree position.
- For the first section of the graph, align the short (four centimetres) side with the X axis. Start at the pen blocker (0 degrees) and draw along the tangent contour upwards until you approach the first asymptote.
- For the second section of the graph find the 180-degrees position (preferably marked with a pushpin).
- Hook the pen blocker onto the pushpin while the tangent curve points downwards. Align the tool with X-axis and draw the lower part of the graph.
- For the third section, rotate the tool 180 degrees counter-clockwise around the pushpin. The tool now has the same position as for the first section.
- The fourth section is similar to the second section. Find the 360-degrees position, hook the pen blocker onto the pushpin, align the tool with the X-axis and draw the curve downwards until approaching the second asymptote.
 Previous section

 Table of content