Skip NavigationMenu

0.1 SinTang tool

SinTang; combination tool for the sine, cosine and tangent graph

Global description
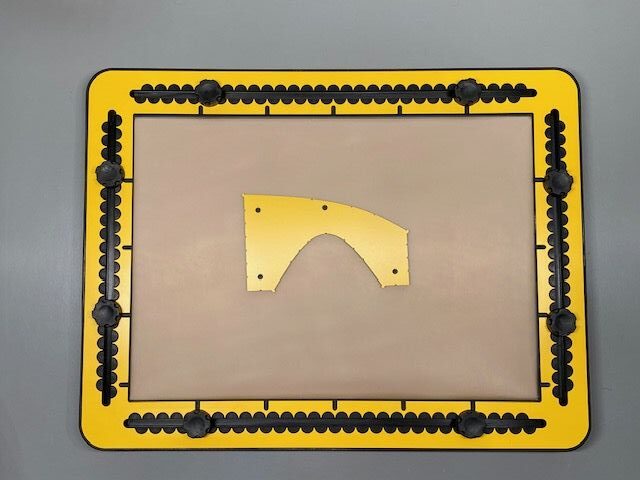
The SinTang tool combines graphs for two formulas; the sin(X) and the tan(X). More precise, a half period of the sine graph and a quarter of the tangent graph.
The sine graph, is the ‘hill’ contour which is the first half period of the sine graph. The cosine is a to the left shifted sine graph.
When placing the tool looking at the hill, the top side of the tool is a left to right downhill slope. After rotating 90 degrees clockwise it represents a quarter of the tangent graph.
The vertical left and right hand sides have an indented centimetre indication.
Pushpin markers are provided at the top surface.
For sine and tangent values of 1, the distance along the Y-axis is 4 centimeters. These dimensions provide sufficient ‘tactile space’.

Detailed description of the sine tool
The range from 0 to 180 degrees X values is distributed over a length of eight centimetres (aprox. 3 inches).
At 90 degrees is the top of the graph (maximum amplitude) at an height of four centimetres.
Small indents are provided in the curve at 30, 45, 60, 90, 120, 135, 150 degrees positions.
Pen blockers are provided at 0 and 180 degrees positions.

Detailed description of the tangent tool
To use the tangent part of the tool it has to be rotated for 90 degrees clockwise.
The contour of the tangent has small indents indicating the 30, 45 and 60 degrees positions on the X axis. The tan(45) is 1. The value of the graph is 4 cntimetres.
Pen blockers are provided at the 0 degrees and towards the 90 degrees position.
A length of four centimetres along the X axis covers a range of 90 degrees.

0.2 Parabola tool

Parabola; X to the power of 2

Detailed description
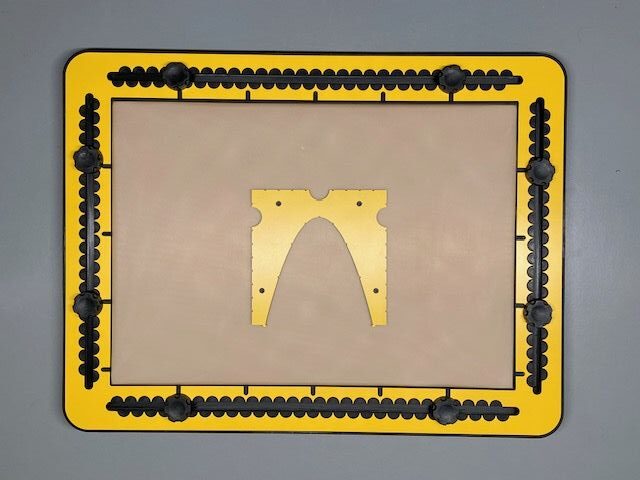
The inner space of this U-shaped tool has the contour of the formula X to the power of two.
The two poles of the U have indented centimetre indications along the outside.
Three medium size alignment indents are provided near the bottom; one in the middle and one in each of the two poles.
Pushpin markers are provided in the top surface of the tool.
The contour of the graph goes down and up again. At the two ends of the contour pen blockers are provided.
Indented positions along the curve reflect Y values for X equals -2, -1, -0,5, 0, 0,5, 1 and 2.

0.3 Lens tool

Lens; tool for convex and concave lens or mirror

Global description
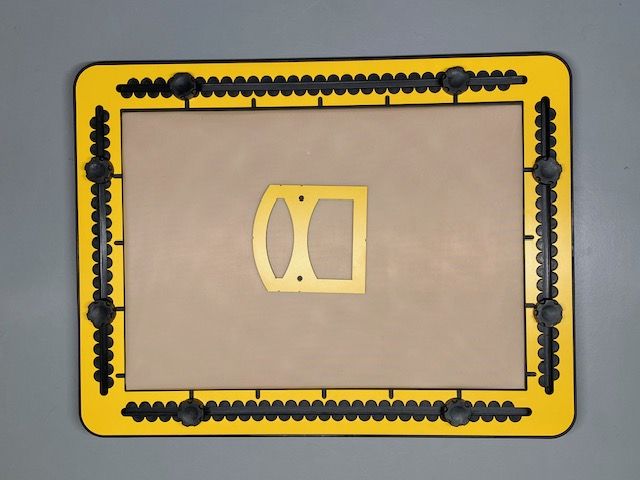
The symmetrical tool could be described as a traditional house where the top part is curved. The first floor is one big window where to top side is curved. The second floor has a window where the top and bottom sides are curved in opposite directions.
The shape of all curves represent the curves of the lenses.
In the top and bottom sides of the tool small indents are provided to align the tool on the median light beam.
Pushpin markers are provided at the top surface.

0.4 Hyperbole tool

Hyperbole; tool to draw y=1/X

Global description
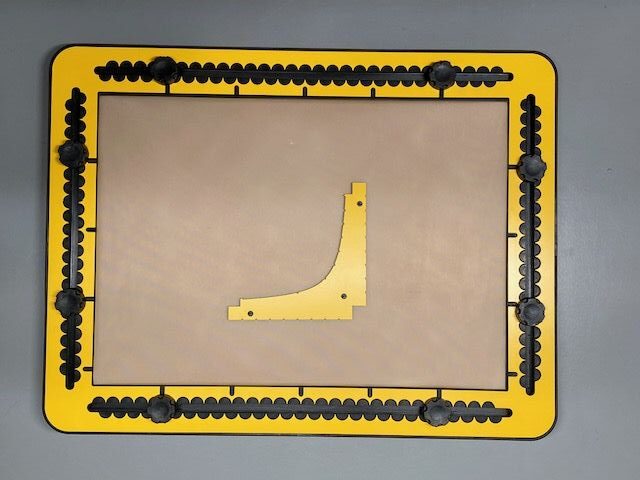
The global shape of the tool is a rectangle hook with the curved contour at the inner side.
Pushpin markers are provided at the top surface.
A small square for alignment is left out at the lower left corner of the tool.
By nature of the formula, the tails of the tool become very thin. To maintain the sturdiness of the tool, additional material has been added.
the graph contour endings contain a pen blocker.

Detailed description
The formula represented in this tool is a smooth curve only going down, seen from
X equals 0 to X equals 8.
Along the curve small indents are provided to indicate Y values corresponding with X values equal 0,25, 0,50, 1, 2, 3, 4, 5, 6, 7 and 8 respectively.

0.5 GraphGrid frame

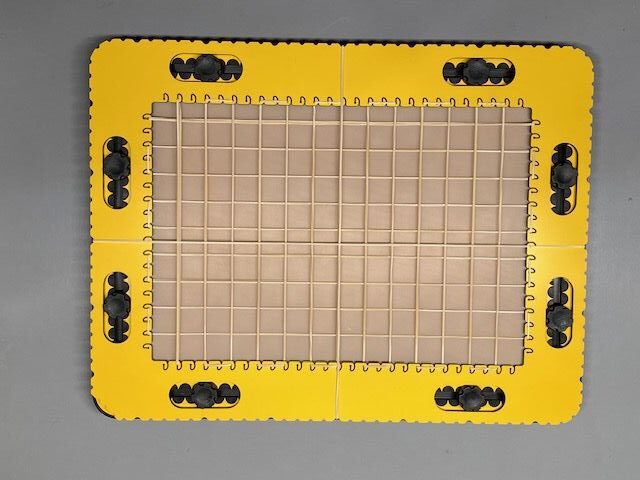
The GraphGrid frame

Detailed description
The GraphGrid frame is yellow with a thickness of four milimetres. It is placed on the TactiPad like a picture frame. Eight oval holes in the frame fit around the knobs of the TactiPad to hold it in place. Three of the four corners are rounded.
Along the inner edge, small curved hooks are placed at a regular interval of 1 centimeter. Along the outer edge of the GraphGrid, indentations are made with a spacing of 1 centimeter as well. Slightly wider indications mark 5 centimeter intervals. The indentations hold rubber bands.
The locations of the hooks and indentations both exactly match with the centimetre scale along the edges of the TactiPad.
The ‘graphing paper’
The measurements of the drawing board become tangible on the entire drawing surface.
The frame overlaps the drawing surface along the edges by one centimeter.
Because of the A4 dimensions of the drawing surface (29.7 cm by 21.0 cm), the centimeter scale is not symmetrical along the TactiPad. Therefore the starting point for horizontal and vertical distances is at the upper left corner of the drawing board and GraphGrid frame when in landscape orientation.