 Previous section
 Return to GraphGrid manual overview
Coordinate system
A crossing of two rubber bands can be considered as a coordinate in a grid system. Starting in the upper left corner of the GraphGrid to the right we call the X direction. Going down is the Y direction. Each crossing is identified by two numbers. With this method, the coordinate 1,1 is the lower right hand corner of the top left cell. The GraphGrid frame does not need axes. The cell size is two centimetres.
Steps
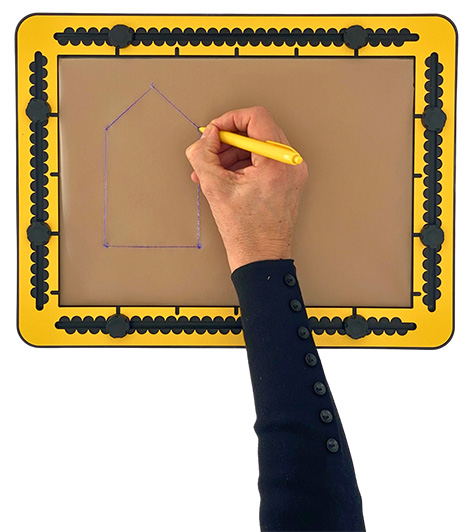
- Place the frame on the drawing board.
- Mark the coordinates as given in the below examples.
- Take the frame away and connect the dots with straight lines as instructed with the word ‘to’.
- Front face of a traditional house A2,8 to B6,8 to C6,2 to D4,1 to E2,2 to 2,8 (which is A again).
- You can add a door or windows by free hand drawing separately or place the GraphGrid once again and mark the respective coordinates.
A cube
The eight corners of a cube are named A To H. The 12 ribs complete the cube. Some of them are marked as ‘dashed’ because they are invisible lines. In coordinates and lines they can be listed as follows:
- Bottom face A2,8 to B6,8 to C10,7 dashed to D4,7 and dashed to A.
- Top face E2,4 to F6,4 to G10,3 to H4,3 to E.
- A to E , B to F, C to G, D dashed H.
Pyramid
- Place the GraphGrid on the drawing board.
- The floor of a pyramid is similar as of a cube. From the four corners sides go up to the top ‘T”.
- The top can be right above the centre of the floor or somewhere else. Create the coordinates and lines A to B to C dashed to D dashed to A.
- The top T has coordinate 5,3.
- Draw the lines A to T , B to T , C to T, D dashed to T.
Share and surprise; connect the dots
You can create a list of coordinates for someone else or you might receive a list of coordinates from someone else. Provide instructions to mark the coordinates and how they should be connected. In the list is an ‘hidden’ image that will appear only when you follow the instructions carefully.
More details
For more detail in the image you can work with halves like 3.5, 6 etc. The level of detail of the image can be increased by working not only with straight lines. Curved lines could be indicated as ‘cu’’ or ‘cl’. The ‘u’ refers to upper half of a circle. The ‘l’ to the lower half of the circle.