Creating drawings based on rows and columns
The GraphGrid consists of a frame equipped with rubber bands to create rows, columns and axes. The GraphGrid also includes tools to draw graphs for standard functions: sine(X), cosine(X), tangent(X), X to the power of two (X^2) and one divided by X (1/X).
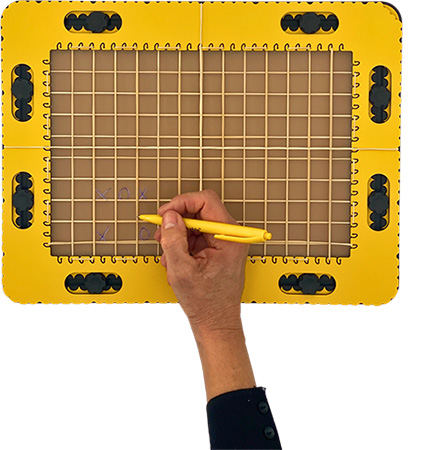
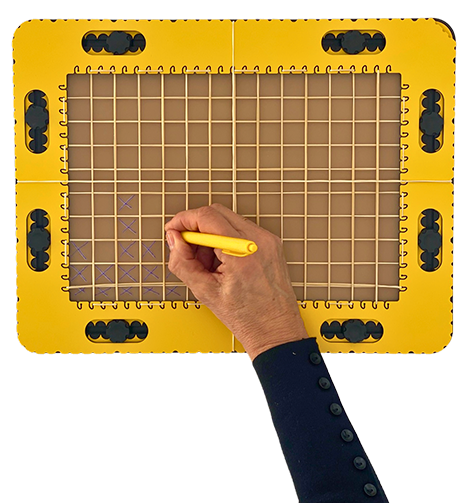
Cells for games
A regular grid of cells, columns and rows can provide useful guidance. For example, creative drawings with patterns in the cells, like a mosaic. Many puzzles and games are played on a game board made up of squares, such as battleships and tic-tac-toe. In games like Yahtzee, you can keep the scores by tallying in the squares. The higher rubber bands around the frame can be used to distinguish different parts of the game board or the scorecard.
Cells for School work
In school, there are many applications where the ‘graphing paper’ of the GraphGrid comes in handy. Using the cells can help with learning to count or to learn the tables of multiplication. In secondary school, the GraphGrid is ideal for making bar charts to present statistical information.
Graphs in mathematics and science
Construct a graph by using the grid as a coordinate system. Higher placed rubber bands can easily be identified as the x- and y-axis. Alternatively, use the hyperbole, parabola or sine/tangent tool to draw a graph quickly and accurately.
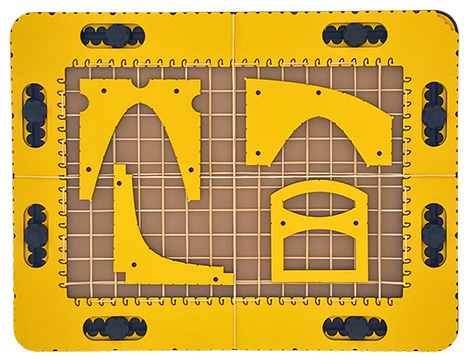
3D shapes
By adding one rubber band that crosses the x- and y-axis a 3D coordinate system becomes available.