This section wants to assist you during your journey to create inspiring and engaging tactile graphics. You find a short description of the content you can create with the sketch utilities, extended with suggestions how to apply them in a day-to-day educational setting.
By considering your goals and the type of tactile content you need, you can create drawings more efficiently, improve accessibility and develop stronger tactile design and reading skills.
Contents
10.1 – Start with the user
10.2 – Define the purpose
10.3 – Available content types
10.4 – Keep exploring
10.1 – Start with the user
Before creating a drawing, consider who and what it will be used.
Key questions to ask
- What is the user’s age range?
- What is the educational level?
- What subject is the drawing for?
- What is the level of tactile reading experience?
- Are you creating for yourselves or others?
- Is the drawing based on existing material or newly created content?
- Is the purpose learning, practising skills, entertainment, or increasing knowledge?
- Will multiple users need to use the same drawing?
Understanding the user helps you choose the right level of detail, complexity and layout.
10.2 – Define the purpose
Clear goals lead to better tactile graphics. Ask yourself what the drawing is meant to achieve.
Common objectives:
- Create a drawing with as little effort as possible.
- Reproduce content that is used repeatedly (for example, coordinate systems).
- Practise drawing skills through exercises.
- Explain educational content clearly.
- Improve tactile reading skills.
- Support teaching for individuals or groups.
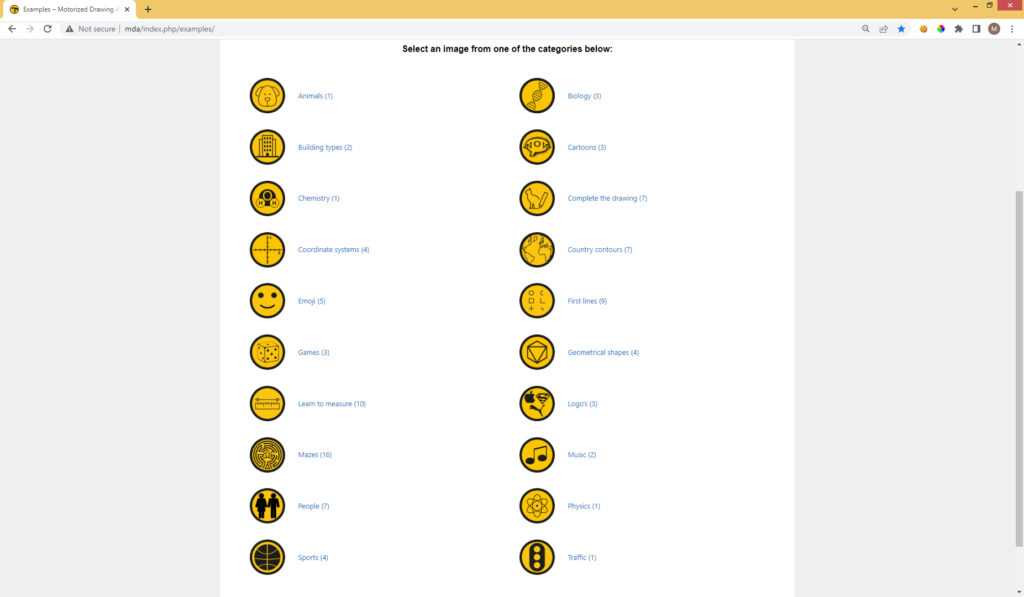
10.3 – Available content types
Two remarks:
- The MDA contains a wide range of ready-to-use sketch utilities from the ‘Examples’ and ‘Interactive’ page. Unfortunately the list below has to be limited. But once you ar using the MDA you have many more available.
- It is very important to realise, that once a drawing is created, the view point can seamless shift from fun, to education to knowledge transfer and vice versa. Especially when adding to and discussing about the drawing. Bring your creativity to the table and try to spend as much as possible time on exploring the drawing.
Examples page
Learn to draw
Sketch the symbols from the category ‘first lines’ or from the ‘complete the drawing’ category to increase drawing skills.
Emoji
Sketch one of the emoji’s and finish it off with additional elements for fun.
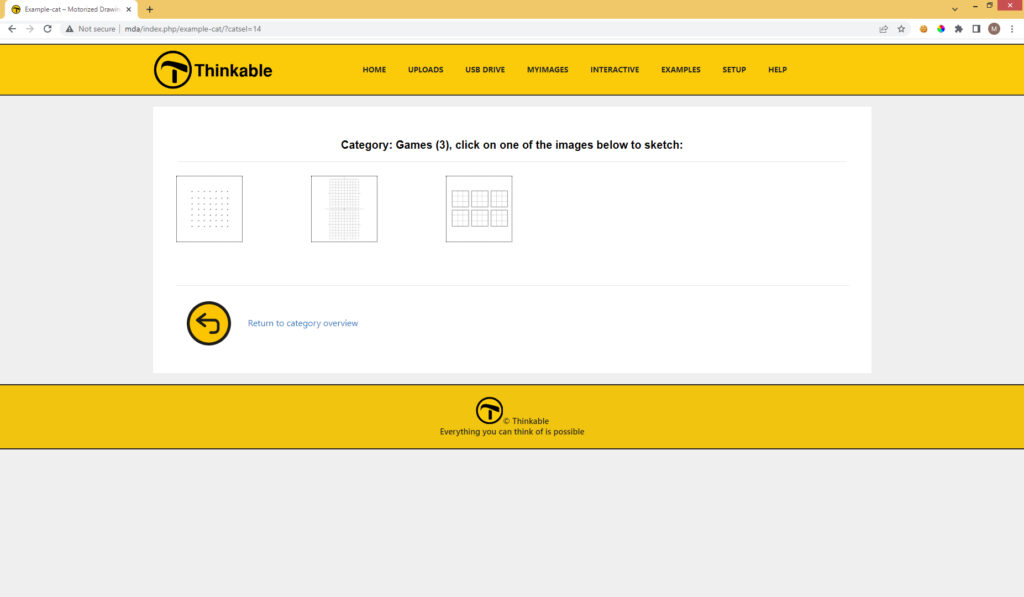
Games
Sketch the battle ship field on a TactiPad. Even more fun when two TactiPads are provided with the playing fields. Two VIPs can now battle to try to submerge the enemy’s ships.
Playing field for ‘dots and boxes’ and ‘tic tac toe’ are provided as well.
Mazes
16 premade mazes with different levels of difficulty: find your way out!
Coordinate systems
4 Different coordinate systems ready to sketch.
Learn to measure
Geometrical shapes in different amounts are given, to discover and measure.
People
Different faces: add jewellery, glasses or hairstyling to the facial views.
Sports
Sport fields to explain the rules and tactics of the games.
Contours of countries
Pre-made contours of some European countries. You can add e.g. cities, rivers or highroads.
Interactive page
Time-clock-calender
Enter a time to generate both an analogue and digital clock.
Text
Create 1 to 5 lines of text, with up to 12 characters per line. Explore the shape of the characters.
Basic shapes
26 Different shapes, among them blocks, triangles, squares, ellipses, spirals and stars of various sizes and arrangements can be created.
Add middle lines or connect them with lines for an art impression.
Geometrical shapes
Generate a 2D representation of a 3D block. Enter dimensions and rotation angles. Hidden lines can be shown or hidden. Drawings may be auto-scaled or produced at 1:1 scale. Add the ‘invisible’ lines to show the 3-D concept is understood. Add dots on the surfaces to transform the cube into a dice.
Charts and tables
This interactive category allows you to produce various types of charts and tables.
Charts
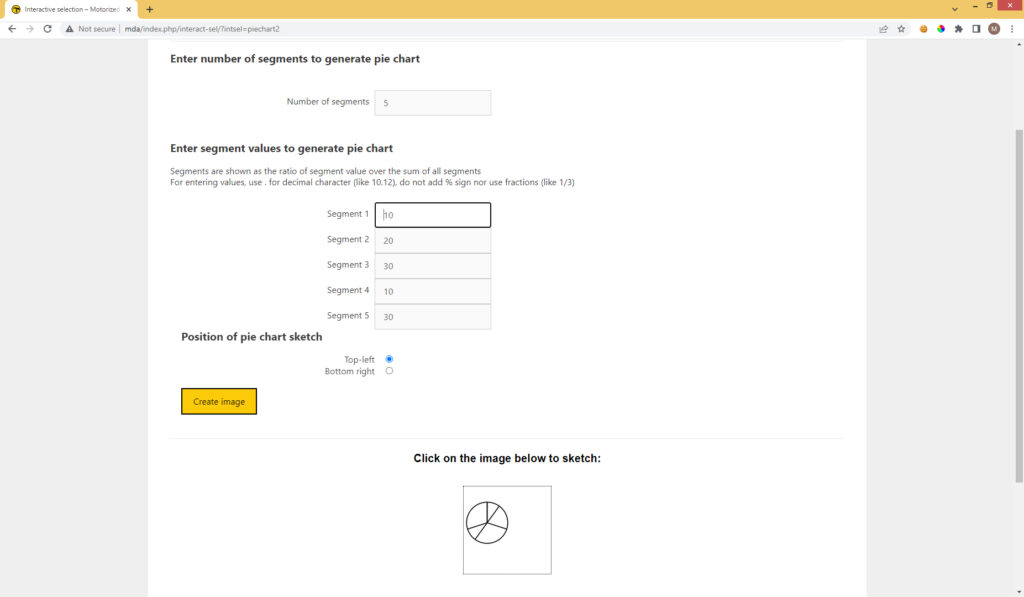
Pie chart – percentage: A pie chart where the parts are represented as percentages. It will allow you to fill in the number of segments, and then how much % each segment will be.
- Pie chart – ratios : A pie chart where the parts are represented as fractions. It will allow you to fill in the number of segments, and then which fraction of the whole each segment will be.
- Bar chart: It will allow you to fill in the number of segments, and the value per segment.
Table
Submit the orientation of the table, the number of cells per row and column, and the dimensions of the rows and columns.
Mathematics
Coordinate system – Scaled to fit page
Set x and y ranges and axis intervals. The coordinate system is automatically scaled to fit the page.
Coordinate system – Scale 1:1
Creates the coordinate system at actual scale. If it does not fit on the page, an error message will appear. Add the graph(s) on to the grid.
Coordinate system for 3D drawings
Designed for three-dimensional graphing and perspective work. Can you draw a cube or prism in here?
Arithmetic
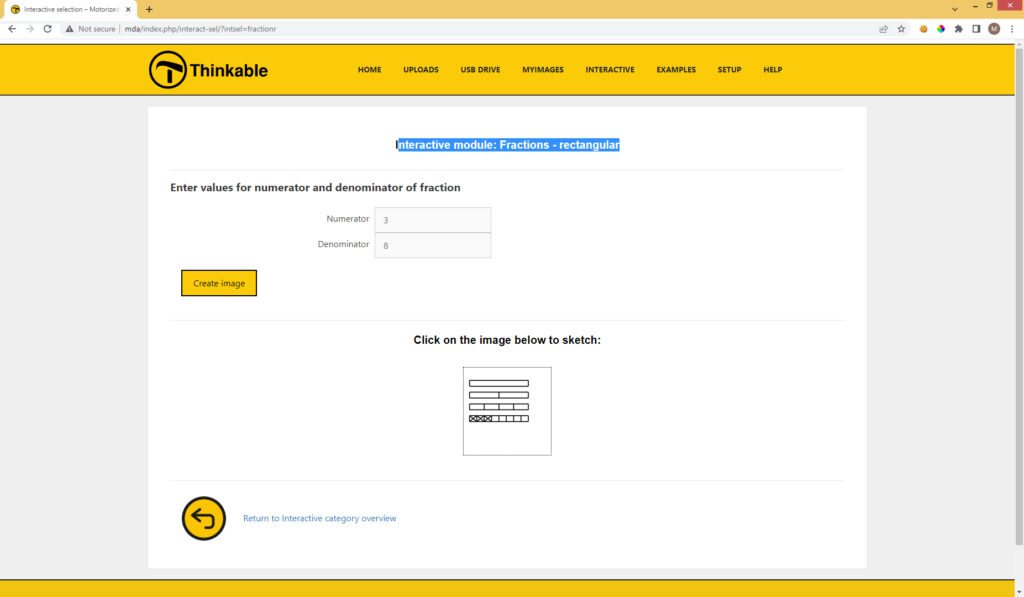
Create a circular or rectangular presentation of a fraction.
Measuring cup
Create a measuring cup and optionally draw the fill level separately.
Maps
Generate tactile maps at different scales, from world maps down to areas of approximately 100 by 100 metres, for any geographical location. Adding lines or circles already to the map can highlight particular area of the map. Add cities to a country contour to confirm geographical knowledge.
Tangram
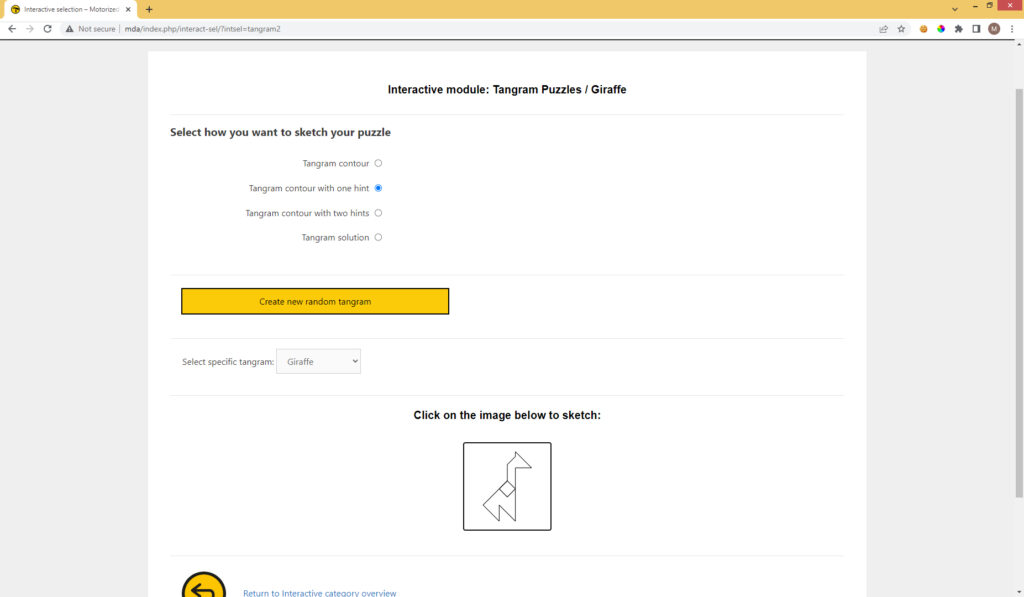
To set your tangram size and 25 tangram puzzles, with options for just contours or with one or two hints or the full resolution. Use a real tangram puzzle to arrange the seven pieces accordingly.
10.4 – Keep Exploring
The MDA is not only a production tool, but also a creative tool. Experimenting with layouts, scales and drawing types will help you discover new ways to create effective tactile graphics.
Third-party software will give you even more playground.
 Previous section

 Table of content