Creating Graphs with TactileView Software Tutorial
Learn how to create mathematical graphs with coordinate systems and grids that are suitable for tactile graphics
Introduction: Graph and Grid
The TactileView drawing tool ‘Draw graph’ has a large number of examples for grids. A complete grid consists of the axis setup, formula(s) and tactile appearance settings. Selecting an example and modifying this will get you in a few steps to a tactile usable graph that can be produced on swell paper, a braille embosser or on the motorised drawing arm (MDA).
Produced in braille or on swell paper, it also will present the text labels for the formula in different mathematical braille notations.
External math software such as MathType that uses MathML file format can be used to import a formula to have this plotted in a graph
(((Placeholder for a picture containing both the tv screenshot and a photo of the printed, sketched and embossed version of the graph)))
‘Graphs’ menu: Many options to chose from
The item in the main menu ‘Graphs’ and the icon in the vertical tool bar ‘Draw graph’ both bring up the same range of features to create a graph with ease. Ease is still a relative concept; to obtain a tactile usable graph quite a number of aspects has to be thought through. Over 30 parameters can be set to design the axes, graph(s) and overall appearance.
Chicken–egg dilemma in tactile drawing with software
When you know what kind of formula you need to have plotted in a graph, you have aspects like the type of the scale, the range and texts for the axis etc. already in mind as well. In other words, do you want to compose the axis setup first (as you would do on paper) so you can add the formula in a second step? Or do you want to enter the formula first (what you can actually do in software) and afterwards adapt the axes fitting the produced graph? With this latter approach you have to be concerned about all the aspects that make the grid a tactile usable diagram.
Solve the dilemma: Grid examples as a starting point
The TactileView software has a number of examples with preset values available for graphs of various types. There are examples for coordinate systems (grids with just the axis settings) and also a number of examples that contain a single formula or even multiple formulas.
A modified example grid can be stored as a ‘MyGrid’ for future use.
Learn how to create three different axis types in this tutorial
The following three worksheets will show you step by step how to create a grid with a linear axis scale, a logarithmic one or using degrees and radians as units.
Worksheet 1: Linear scale
When we set our first steps in math, we begin with linear functions. A Function like plus (+), minus (-), multiply (*) or division (/) can be used for any value of x. Also square, square root and power are common.
In most cases they are plotted on a linear scale from a negative (when allowed) to a positive value. For a linear scale the distance from one value to the next is always the same.
You can apply all the known constants like Pi, E and Fi in the formula. The available functions and constants can be selected from a list or the formula can be entered in a text box.
Detailed instructions
Open the ‘Graphs’ item from the main menu or click the ‘Draw graph’ icon in the vertical toolbar. Select the ‘formulas and graphs’ option.
In the dialogue box, select ‘linear’ scale type. Browse the list and select the example grid with the formula x to the power of 2 (x^2).
To check/set the range for X and/or Y axis, use the ‘change coordinate system’ button. The dialogue box “Grid Properties” will show you the horizontal (X) and vertical (Y) axis. Open the respective option to change. Exit with ‘OK’.
To enter a second formula, which will produce a second graph in the same grid, use the ‘Multiple Formulas’ button. The dialogue box “Grid Properties” will now show you a list of (filled and empty) formulas. Open ‘Formula 2’ and insert 0.5*x-1 in the field behind “y=”. Exit with ‘OK’.
To finalize, choose either the ‘Insert in new document’ or ‘Insert in current document’ button.
Once you have the grid inserted in the document you can produce the image on swellpaper, emboss it on a braille embosser or sketch it with the MDA.
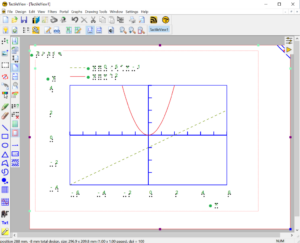
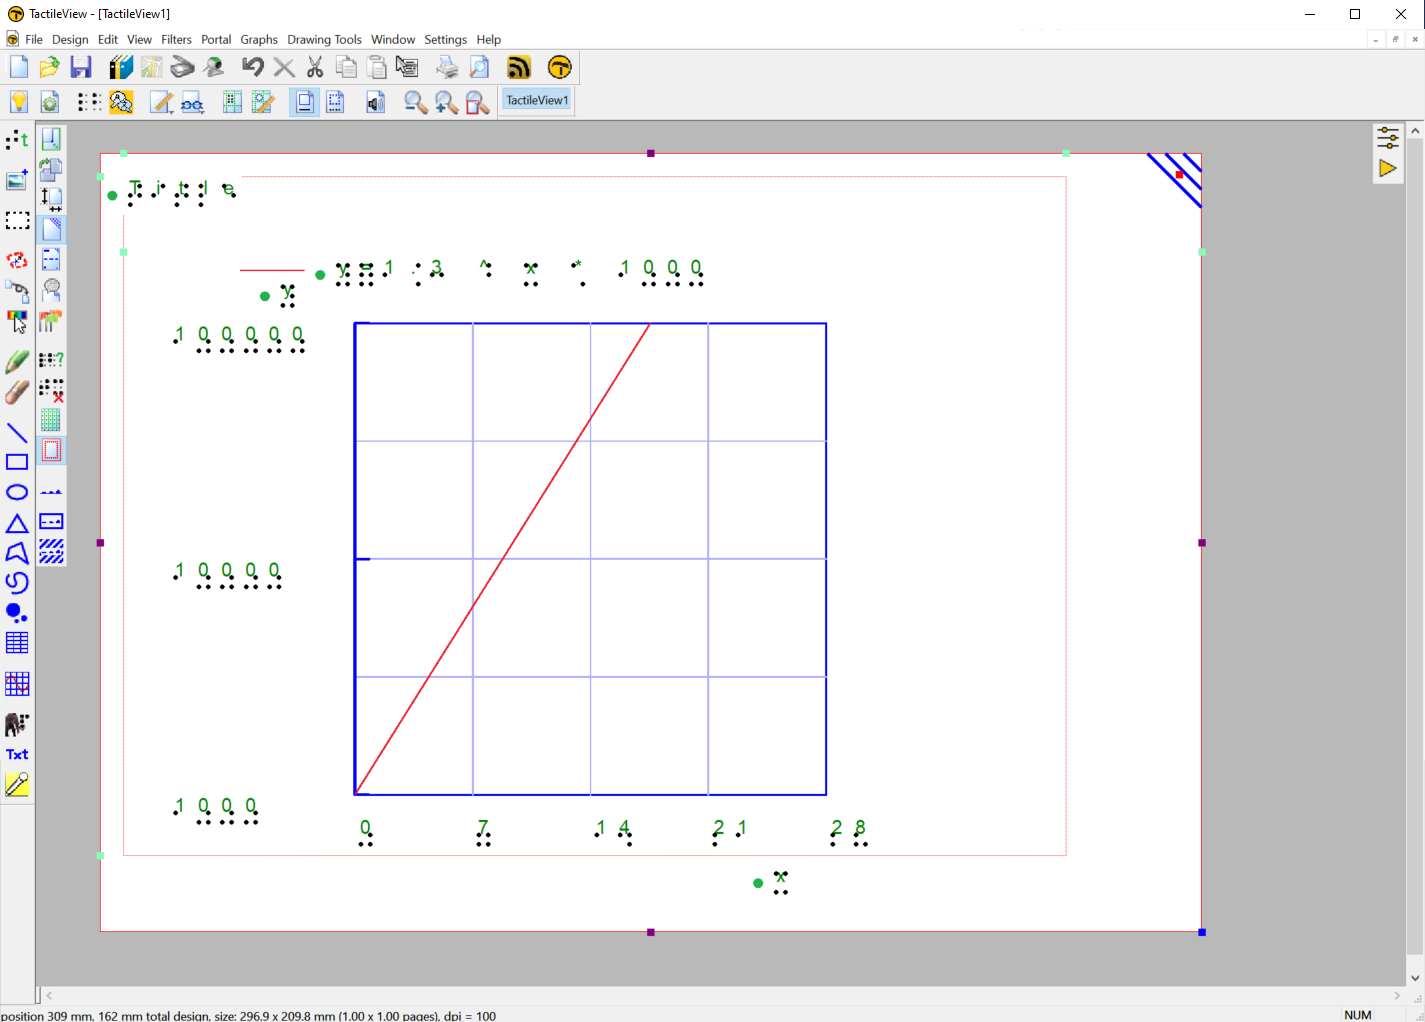
Screenshot: TactileView creating a linear axis grid with graphs of two formulas (x^2 and 0.5*x-1).
Worksheet 2: Logarithmic Y scale to represent the Covid19 infection cases
The range for the X axis for this graph is in days. We want to see what the absolute effect of the virus is after a number of days, given a known reproduction rate and a number of infected cases. This axis is linear: the distance from one day to the next is always the same.
The Y axis has a logarithmic scale to indicate the number of infections. The higher the values and the more upwards the axis goes, the same distance between two points on the axis contains ever larger numbers.
For example: If the first centimeter on a logarithmic scale goes from 0 to 10, the second centimeter could already go from 10 to 100 and the third centimeter from 100 to 1000. As a result, compared to linear scales, quickly rising numbers with very steep and sharply pointed graphs can be “pressed together”. Having a logarithmic scale thus allows to have a large range in a small and compact graphical representation.
Detailed instructions
Open the ‘Graphs’ item from the main menu or click the ‘Draw graph’ icon in the vertical toolbar. Select the ‘formulas and graphs’ option.
In the dialogue box, select ‘logarithmic’ scale type. Browse the list and select the example grid with the formula y=1.3^x*1000.
To check/set the range for X and/or Y axis, use the ‘change coordinate system’ button. The dialogue box “Grid Properties” will show you a list with items. The horizontal (X) and vertical (Y) axes are two of them. Open them to make your preferred changes. For example: Open ‘Horizontal (X) Axis’ and change the number of days on the axis from 28 to something else in the field ‘Highest value on X Axis’. Exit with ‘OK’ each time.
To change the formula, use the ‘Change Formula’ button. Change the numeric values in the field behind “y=”. (Note: The symbol for ‘power of’ is ^. The default values of this grid example are: 1.3 as reproduction rate, 1000 as number of infections on day 1. The value for x is taken from the x axis and represents each day on that scale). You can either select ‘Renew Preview’ or directly exit with ‘OK’.
To finalize, choose either the ‘Insert in new document’ or ‘Insert in current document’ button.
Once you have the grid inserted in the document you can produce the image on swelllpaper, emboss it on a braille embosser or sketch it with the MDA.
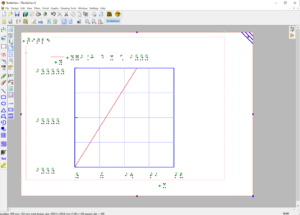
Screenshot: TactileView creating a grid with logarithmic Y axis and one graph (formula: 1.3^x*1000 [a possible Covid-19 reproduction rate]).
Worksheet 3: Scale in degrees or radians for goniometrical functions
Sine or cosine graphs (or combinations of both) are applied in many domains. To understand the basics, they can be plotted with two different scale types. One way is to have the variable for the X axis in degrees. The range is in many cases from 0 to 360 degrees or maybe more to show the cyclic effect.
Alternatively, the X axis can be set to radians.
Selecting radians for the X axis will state ‘pi’ for the name for the X axis.
Set the range from zero (0) to two (2) for a full cycle. In case of Pi, the X parameter may have a negative value.
A sine graph with the X axis 0 to 360 degrees or 0 to 2 Pi will have the same shape, assuming the same amount of distance in centimeters or inches from the lowest to the highest value is set for both.
Detailed instructions
Open the ‘Graphs’ item from the main menu or click the ‘Draw graph’ icon in the vertical toolbar. Select the ‘formulas and graphs’ option.
In the dialogue box, select ‘degrees’ or ‘radians’ scale type. Browse the list and select an example grid with sine or cosine.
To change the X axis’ scale type from ‘degree’ to ‘radians’ or vice-versa, use the ‘change coordinate system’ button. Open the horizontal (X) axis properties to switch ‘type’ between ‘degrees’ or ‘radians’. Exit with ‘OK’ each time.
To finalize, choose either the ‘Insert in new document’ or ‘Insert in current document’ button.
Once you have the grid inserted in the document you can produce the image on swelllpaper, emboss it on a braille embosser or sketch it with the MDA.
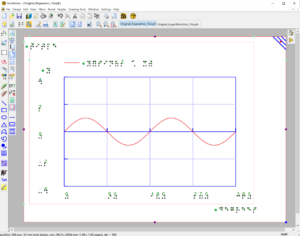
Screenshot: TactileView creating a grid with an X axis in degrees and one graph (sine formula; wave shape).