 Previous section
 Return to TactileView manual overview
General colour use in TactileView
![]() Green
Green
The colour green is used as a colour for information. Everything you see in this colour is NOT printed on the design. Examples are: the font ‘beneath’ the braille dots of the textlabels, the alignment lines for the text labels, the grid for aligning object in the drawing area, the letters at the angles for the triangle.
![]() Blue
Blue
Objects created with one of the drawing tools (square, line, circle, dot, etc.) are presented in blue. Variations of blue are used to indicated the selected dot height (for embossers that support varying dot heights). A lighter blue colour indicates a lower dot height.
![]() Black
Black
Lines that are created with the drawing tool ‘Retouching: Adding lines’, are drawn in black. This indicates that the line is part of the underlying bitmap in the design. The bitmap consists of individual pixels that can be erased by choosing ‘Retouching: Erase’.
Any colours present in images inserted from file or from the internet will be converted to braille dots. These images should be processed using the filters and be converted to black/white in order to print them in braille lines.
![]() Purple
Purple
Markers are placed on or around a selected object. These markers can be used to reposition or resize the object, or change its proportions. Markers with a different function will have a different colour instead of purple.
![]() Red
Red
A red border is surrounding the drawing area, reflecting the printable area of a sheet of paper in the selected paper size. When the designs exceeds this initial area, the red borders will signify that multiple sheets of paper will be printed that together will contain the design.
Special cases
Text labels
A rounded marker precedes each text label to signify the type of input used for the specific label.
 Green is used for text labels entered with the regular computer keyboard;
 Orange for those that were created with Perkins style input;
 Grey/blue for mathematical textlabels, created with the MathType equation editor.
When multiple formulas are used in a graph, each formula in a graph will have its own colour (red, green, blue and yellow) to easily distinguish between them. These different colours are only used for display on the screen and will not lead to differences on a print.
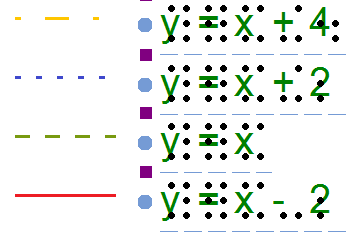
Figure 1. Colours are used on screen to distinguish between different formulas.
In a single document, multiple braille tables can be used to accommodate for language variations. In the design toolbar (right vertical toolbar when nothing is selected), click ‘Show used braille tables’ to see an overview of the different braille tables in the design. Colours are used in the legend and design to distinguish the different braille tables.
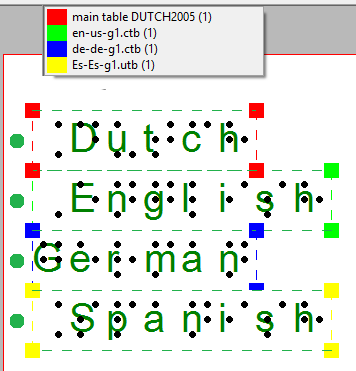
Figure 2. The colours in the legend and text labels signify the used braille tables.
Objects with audiostyles are presented with a light red/pink fill.
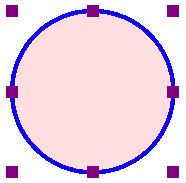
Figure 3. The light red colour signifies that the circle contains an audio style.