 Previous section
 Return to TactileView manual overview
TactileView provides the ability to graph four or more formulas at the same time. In the ‘Creating a graph‘ section you can read how to prepare a graph with a single formula, to which you can add additional formulas as described below.
Select the graph in your design to which you wish to add a formula. Similar to creating a new graph, when adding a formula you need to choose which input method you want to use: you can either enter the formula with MathType as an equation editor, or use the keyboard to enter the formula. From the properties toolbar or context menu of the selected graph, choose ‘Add function: keyboard input’ or ‘Add function: equation editor’. In the dialog that appears, you can enter your new formula in the same way as when you created the graph.
Notice that by default a dashed line style is selected to distinguish the different formulas from each other, but you can change this to Line, Dot or Long/Short Broken if you wish. It is recommended to choose a different line style for each formula you enter. The legend above the graph shows which formula corresponds with which line style. On screen, four different colours are used to easily distinguish between the formulas.
You can apply any changes in the graph preview on the right side of the dialog at any time by choosing the ‘Apply’ button. When you are satisfied with the selected options for the new formula dialog, choose the ‘OK’ button to save your changes, close the dialog and update your graph. In the properties toolbar you will see that the icon for ‘Formula 2’ is no longer greyed out, indicating that a second formula is present in the graph.
You can add a third or fourth formula by following this same process after selecting the graph and choosing ‘Add function: keyboard input’ or ‘Add function: equation editor’ from the properties toolbar or context menu. If you wish to include more than four formulas, you will need to add the remaining formulas to one of the first four, seperated by a semicolon: e.g. sin(x^2);cos(x^2). These will be plotted as seperate lines, but with the same line style and other properties.
‘Add function: equation editor’ icon:
‘Formula 1-4’ icons:
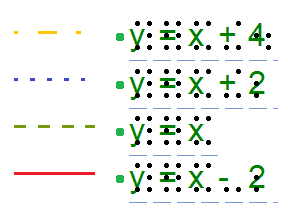
Figure 1. Different line styles, such as dashed or dotted lines, are used to distinguish different formulas in a graph; on screen, colours are used to signify these differences.