Skip NavigationMenu

06. More ideas


Using rubber bands

Indentations are placed around the outside of the circle frame in which rubber bands can be attached. These indentations are positioned at every 10 degrees seen from the centre of the circle. Slightly wider indents make the positions for 0, 30, 45, 60, 90 degrees, etc. easily recognizable.
When spanning to opposing indentations with a rubber band, they meet the centre, forming also the diameter of the circle.
It also exactly coincides with the degree indications along the circle.

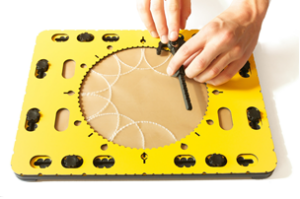
Photo: The compass foot on the edge of the circle frame. The compass scratcher set at 10 centimetres


The compass and the circle frame / circles in a circle

The indents at the edge of the circle frame have the same diameter as the needle of the compass.
Place the compass foot partly on the edge so the needle of the compass fits in indentation of the circle frame. Set the desired radius for the circle to be drawn.
The set radius for the circle determines the length of the curve that can be created.

Fantasy

As an example set the radius at 10 centimetres. Place the compass at 12 o’clock and draw the maximum possible curve. Place the base at 3, 6 and 9 o’clock respectively and create the curves as well.
The curves will cross in the middle of the circle.
Finally trace the circle’s contour and remove the circle frame.

01. Getting started

The CircleFrame includes the Zigzag triangle, the 468triangle and the Wedge tool.
They are only applied in conjunction with the circle frame.

Preparation
Place the knobs of the TactiPad five centimetres away from the corners. The eight holes in the circle frame can now fit around the knobs.
Insert one of the tools in the circle.

For the circle frame see the link:
Circle frame

For the tools see the links:
Zigzag triangle

468Triangle

Wedge tool

For additional applications see the link:
Miscellaneous

0.5 GraphGrid frame

GraphGrid frame manual

Preparation
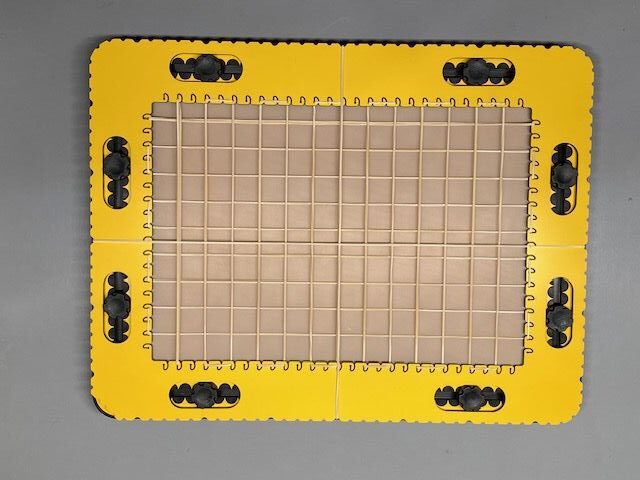
The default setup has rubber bands every two centimetre in horizontal and vertical direction, so forming a grid.
Two rubber bands go around the frame to indicate two axes.
However, before mounting the GraphGrid frame on the TactiPad make sure all rubber bands are provided according your preference.

Low and high rubber bands – Using differences in height
The framework of the GraphGrid has a thickness of four millimeters. Therefore there is a well noticable difference in height between the bands that run along the top side (outer) part or the bottom side (inner)
Part of the frame. The lower rubber bands that are attached to the hooks run alongside the inner part of the GraphGrid and can lay flat on the drawing surface.
The rubber bands can be placed horizontally and vertically with a minimum distance of 1 centimeter.
The bands can also be placed at an anglle of any number of degrees.

Note: The hooks at the inside edge are at every centimetre. Adding rubber bands to each hook will result in a (too) denced grid.

Placing the grid lines and axes
The hooks and indents are positioned every centimeter along the frame, so the minimum cell dimensions are one by one centimeter. To form a larger grid, you can place the rubber bands two or more centimeters apart by skipping one or more hooks.

Spare rubber bands
Additional rubber bands for more grid lines and axes are supplied with the GraphGrid. These are standard, thin rubber bands with a length of 12 to 15 centimetres.
To keep the rubber bands in place, the hooks have such a shape that the rubber bands will not come loose if they are positioned properly in the frame. Pplacing a rubber band is easiest if you hold the rubber band with two hands, keeping it perpendicular to the frame so you can slide it through the slot to the end of the hook. First of all, you span the rubber band in two opposing hooks, so that it forms a double line between two sides of the GraphGrid. You then take the upper of these two lines and slide it into the next desired hook in both sides of the frame to form the second grid line.
The higher rubber bands are stretched around the outside of the GraphGrid and fall naturally into the indents.

Getting started
To begin with, make sure the TactiPad has the landscape orientation with the hinge facing backwards.
To hold the GraphGrid frame,, place the knobs at aproximately five centimeters away from the corners.
To position the GraphGrid frame correct, place the flat corner in the upper right corner of the TactiPad.
It is possible that of one of the rubber bands coincides with the position of one of the knobs. Therefore, the holes in the GraphGrid around the knobs are ​​extra-long so you can slide the knobs aside for the desired placement of the rubber band.
0.5 GraphGrid frame

The GraphGrid frame

Detailed description
The GraphGrid frame is yellow with a thickness of four milimetres. It is placed on the TactiPad like a picture frame. Eight oval holes in the frame fit around the knobs of the TactiPad to hold it in place. Three of the four corners are rounded.
Along the inner edge, small curved hooks are placed at a regular interval of 1 centimeter. Along the outer edge of the GraphGrid, indentations are made with a spacing of 1 centimeter as well. Slightly wider indications mark 5 centimeter intervals. The indentations hold rubber bands.
The locations of the hooks and indentations both exactly match with the centimetre scale along the edges of the TactiPad.
The ‘graphing paper’
The measurements of the drawing board become tangible on the entire drawing surface.
The frame overlaps the drawing surface along the edges by one centimeter.
Because of the A4 dimensions of the drawing surface (29.7 cm by 21.0 cm), the centimeter scale is not symmetrical along the TactiPad. Therefore the starting point for horizontal and vertical distances is at the upper left corner of the drawing board and GraphGrid frame when in landscape orientation.

0.4 Hyperbole tool

Hyperbole manual
Photo: An X and Y axis are drawn. The graph is drawn in the first quadrant. The tool has been rotated 180 degrees clockwise so the second part can be created. A pushpin is at position X=0,Y=0.

Draw an X and Y axis with the ruler
Be aware, the effect of the additional material is also that the actual X and Y axis are covered by the tool.
Align the tool with the two axis by placing the flat sections at the tails with the axis.
For convenience you can place a pushpin in the crossing of the X and Y axis.
Draw along the contour of the tool.
Rotate the tool 180 degrees clockwise. Align the tool with the axis and draw the second part of the graph.

0.4 Hyperbole tool

Hyperbole; tool to draw y=1/X

Global description
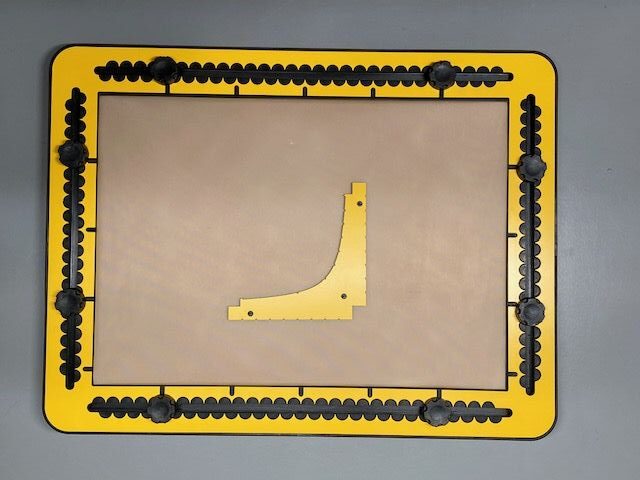
The global shape of the tool is a rectangle hook with the curved contour at the inner side.
Pushpin markers are provided at the top surface.
A small square for alignment is left out at the lower left corner of the tool.
By nature of the formula, the tails of the tool become very thin. To maintain the sturdiness of the tool, additional material has been added.
the graph contour endings contain a pen blocker.

Detailed description
The formula represented in this tool is a smooth curve only going down, seen from
X equals 0 to X equals 8.
Along the curve small indents are provided to indicate Y values corresponding with X values equal 0,25, 0,50, 1, 2, 3, 4, 5, 6, 7 and 8 respectively.

0.3 Lens tool

Lens manual
Photo: for the application the tool is rotated 90 degrees. The median light beam is drawn. A convex lens has been drawn. The tool is positioned to create the mirror.

Draw a line with the ruler to represent the median light beam.
Align the tool on the line.
Draw the inner contour for the mirror, the convex or the concave lens.
You can add additional light beams to show light breaking and reflection effects.

0.3 Lens tool

Lens; tool for convex and concave lens or mirror

Global description
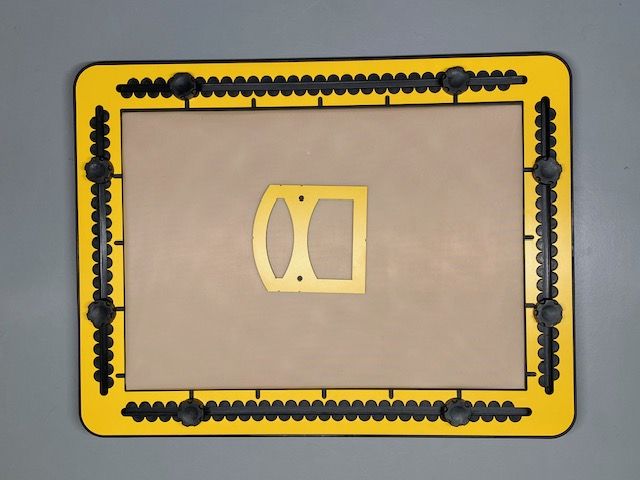
The symmetrical tool could be described as a traditional house where the top part is curved. The first floor is one big window where to top side is curved. The second floor has a window where the top and bottom sides are curved in opposite directions.
The shape of all curves represent the curves of the lenses.
In the top and bottom sides of the tool small indents are provided to align the tool on the median light beam.
Pushpin markers are provided at the top surface.

0.2 Parabola tool

Parabola manual
Photo: A parabola has been drawn at X=0 and Y=0. The tool is positioned to create a second one at X-3 and Y=2.

Draw an X and Y axis.
Align the bottom indent with the Y axis and the ones in the poles with the X axis.
Draw along the contour of the tool.
You may choose any other coordinate as the minimum for the y value. The centimetre indications help to align the tool with the axes.

0.2 Parabola tool

Parabola; X to the power of 2

Detailed description
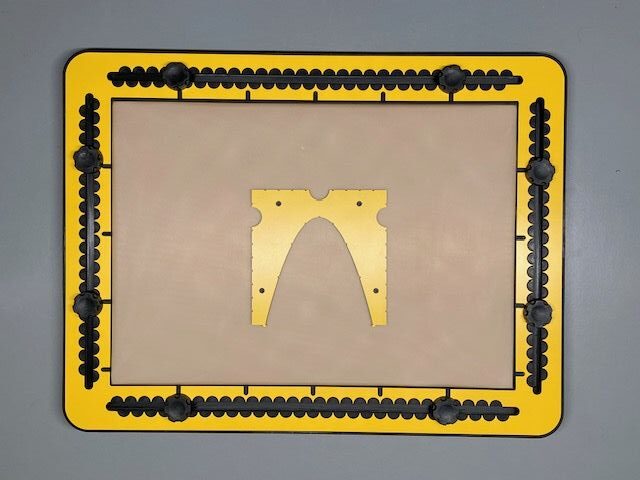
The inner space of this U-shaped tool has the contour of the formula X to the power of two.
The two poles of the U have indented centimetre indications along the outside.
Three medium size alignment indents are provided near the bottom; one in the middle and one in each of the two poles.
Pushpin markers are provided in the top surface of the tool.
The contour of the graph goes down and up again. At the two ends of the contour pen blockers are provided.
Indented positions along the curve reflect Y values for X equals -2, -1, -0,5, 0, 0,5, 1 and 2.