The drawing tools icon bar contains all the drawing tools to create objects with specific shapes such as lines, dots, circles and squares. The objects provide accuracy in your drawings and are indicated in blue on screen.
General operation for the tools
After selecting a drawing tool, a second vertical toolbar will appear. Depending on the tool, this toolbar will present you with a number of options that can be selected before the object is placed in the design.
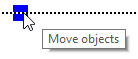
To place the object, move the mouse to the drawing area and click where the object should be placed. The cursor will also indicate the selected drawing tool. Hold and drag or click in a second position to determine the size and position of the object. Purple markers on or around the objects allow for repositioning, resizing or changing the proportions.
An object as a whole can be deleted by the delete key or selecting ‘Delete’ from the icon bar or context menu. It is not possible to erase parts from the object unless it has been fused to the bitmap (see: ‘Working with fused bitmaps‘).
After placing an object in the design, a second vertical toolbar will appear, presenting the specific properties for the drawn object. Reselecting the object later on will bring up the same properties icon bar.
A number of properties are common for all objects. These will be explained in a separate section: Editing object properties.
Drawing straight lines
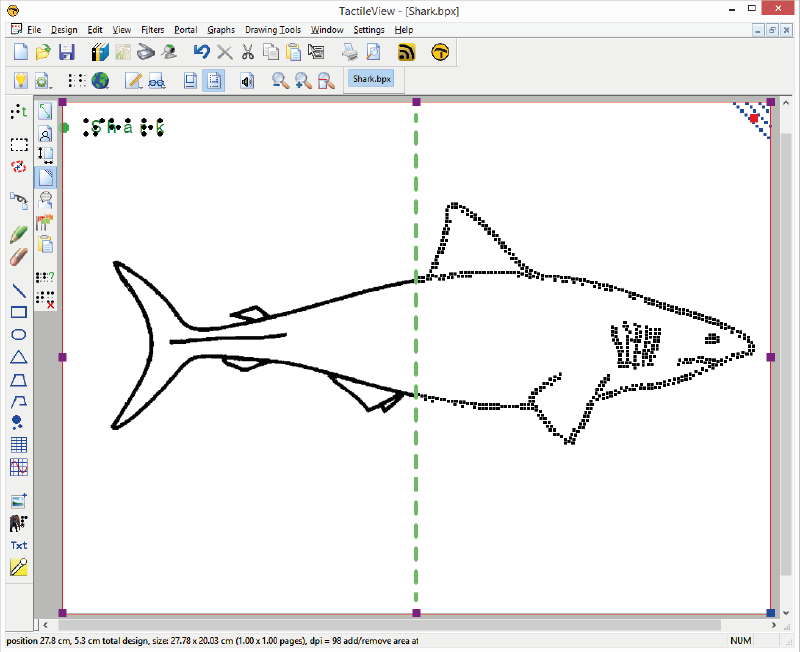
To draw a straight line, choose the ‘Draw Straight Line’ icon from the toolbar on the left side of the screen. In the design area, click the starting position for your line, then click the end position.
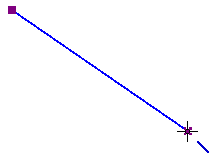
Figure 1. Drawing a straight line in the design.
‘Draw straight line’ icon: 
Drawing squares and rectangles
To draw a square, choose the Draw Square-Rectangle icon from the tool bar on the left side of the screen. Click in the design to mark the position of the first corner, then move the mouse to determine the size of the square and click a second time to confirm. Alternatively, you can click and drag, then release at the opposite corner.
By dragging the markers in one of the four corners the size can be increased or decreased. Dragging inwards or outwards with the markers in the middle of the four sides will turn the square into a rectangle.
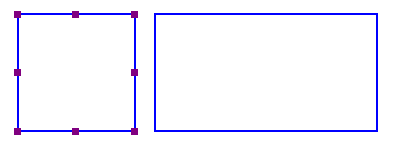
Figure 2. A square and rectangle drawn in the design.
‘Draw square-rectangle’ icon: 
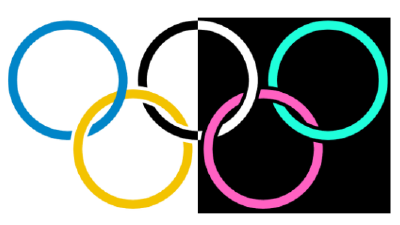
Drawing circles and ellipses
To draw a circle, choose the ‘Draw Circle-Ellipse’ icon from the left vertical tool bar on the left side of the screen. In the design area, click the location for the first position, then move the mouse until the circle is the desired size and click again to confirm. Alternatively, you can click and drag, then release at the opposite corner.
By dragging the markers in one of the four corners the size can be increased or decreased. Dragging inwards or outwards with the markers in the middle of the four sides will turn the circle into an ellipse.
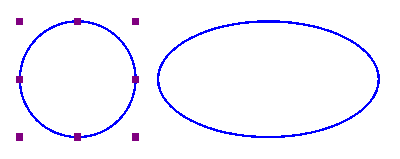
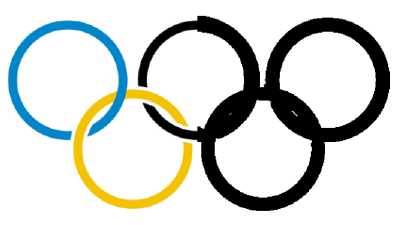
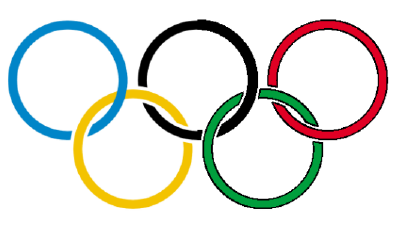
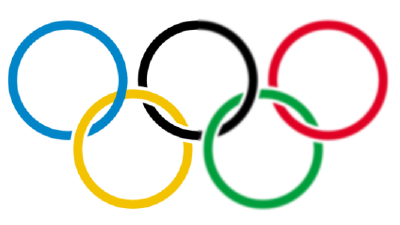
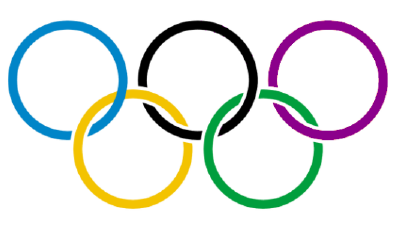
Figure 3. A circle and ellipse drawn in the design.
‘Draw circle-ellipse’ icon: 
Drawing triangles
To insert a triangle into your drawing, select the ‘Draw Triangle’ icon from the left vertical toolbar. Next, select what type of triangle to insert from the right vertical properties tool bar that appears.
The bottom four icons on this tool bar show the available types of triangles. From top to bottom, the triangle types available in the tool bar are right, isosceles, equilateral and scalene. Triangles may be changed from one type to another after you have placed them in your drawing, but it is easiest to select the appropriate triangle type prior to inserting the shape.
Once you have selected the type of triangle you want, click the point in the design area where you want one of the corners and then drag until the triangle is the desired size. Alternatively, you can click and drag, then release at the opposite corner.
The ‘Angles and lines’ dialog can be used for a more mathematically oriented notation. The corners of the triangle are marked with letters A, B and C. By default they will only show on screen (green colour, not embossed). By checking ‘Characters A, B, C at corners’ in the ‘Angles and lines’ dialog, they will also be presented in braille characters once embossed.
The corners of the triangle can each be provided with 3 types of specific lines: altitude, median line and bisector, which will be embossed as dotted lines.
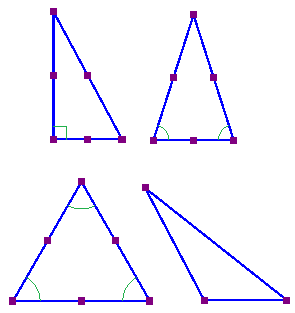
Figure 4. Four different types of triangles: right, isosceles, equilateral and scalene. Equal or right corners are indicated in green.
‘Draw triangle’ icon: 
Drawing polygons
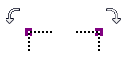
A polygon consists of several lines that are connected as one object. To insert a polygon, choose the ‘Draw Polygon’ icon from the tool bar on the left side of the screen. Click in a number of positions in the design area to draw a polygon. To finish the polygon, click on the first anchor point (first purple marker) to close the polygon. Alternatively, you can click again on the last placed anchor point to make an open shape. You can also choose these two options from the toolbar or context menu by selecting ‘Close polygon’ or ‘Finalize the polygon (leave the last connection open)’.
When you have an open polygon selected, two green plus symbols on screen allow you to continue drawing at the ends of the polygon. You can also choose ‘Continue drawing at first/last endpoint’ from the context menu. The red border around a selected polygon can be used to resize it by dragging the purple markers.
You can choose between straight and curved lines between the anchor points. This allows you to make use of rounded curves in your design.
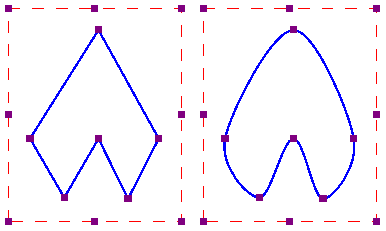
Figure 5. Two polygons show the difference between straight and curved lines.
‘Draw polygon’ icon: 
Drawing freehand line or closed shape
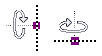
To draw freehand lines or closed shapes, choose the Draw Freehand Line or Closed Shape icon from the tool bar on the left side of the screen. In the design area, click the desired starting location and drag the mouse to create the desired line. To create a closed shape, click the desired starting location and drag the mouse to create the desired shape, returning to the starting location before releasing the mouse button.
As with the polygon, you can choose between straight and curved lines between the anchor points. The dashed red border can be used to resize the entire object.
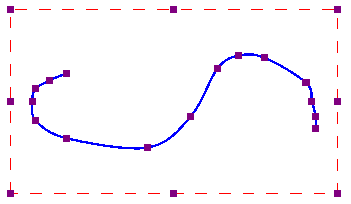 Freehand line with curved lines.
‘Draw freehand line or closed shape’ icon: 
Drawing dots
To add round dots to your design, select the ‘Draw filled dots’ from the let vertical toolbar, then click in your design to position the dot. The size of the dot can be changed with the purple markers. The dot size can range from only one braille dot up to a large filled circle of multiple centimetres in diameter.
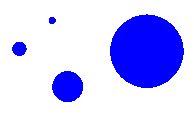 Different sized dots can range from a single braille dot to several centimeters in diameter.
‘Draw filled dots’ icon: 
 Previous section
 Return to TactileView manual overview