Previous section
 Return to TactileView manual overview
Retouching: adding and erasing lines
All TactileView designs have a bitmap that acts as the ‘base layer’. This bitmap layer can be edited using the retouching tools.
See also: Working with fused bitmaps
To draw freehand lines that are automatically part of the bitmap and not editable, select the ‘Retouching Adding lines’ icon from the toolbar on the left side of the screen, or select ‘Retouching: Adding lines’ from the Drawing Tools menu. Select the line thickness you would like to use prior to starting to draw by using the slider next to the properties toolbar. You can use Shift+scroll wheel for more convenient size adjustment while drawing in the design. In the properties toolbar or context menu, you can choose between a round or a square pen or eraser shape by selecting ‘Apply circular tip’ or ‘Apply square tip’. You can also choose to draw straight or curved lines by choosing ‘Use straight lines’ or ‘Free style (follow the mouse)’.
You can now use the mouse to draw in the design area. Anything you draw with this tool will automatically be part of the bitmap and will not be editable unless you select an area containing your drawing and convert it to a figure or use the ‘Detect shape’ feature to create an editable object from a freehand closed shape. The retouching mode will continue until you select another mode or drawing tool, or until you press the escape key on the keyboard.
‘Line thickness’ icon: ![]()
Figure 1. Use the slider or Shift+Scroll wheel to adjust the line thickness.
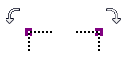
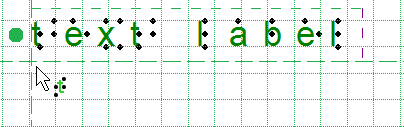
‘Use straight lines’ icon: ![]()
‘Free style (follow the mouse)’ icon: ![]()
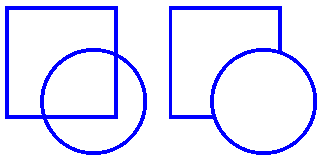
Figure 2. Drawing straight or curved lines.
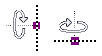
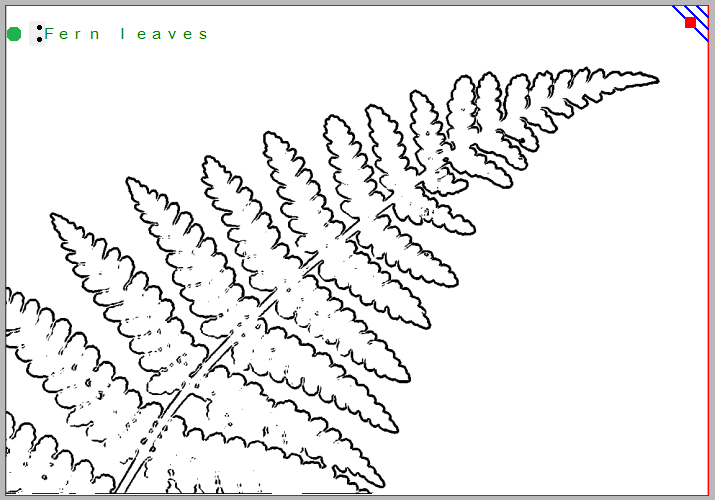
‘Apply circular tip’ icon: ![]()
‘Apply square tip’ icon: ![]()
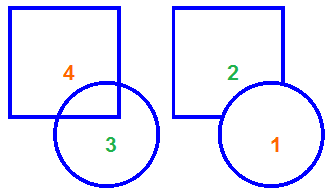
Figure 3. Using a circular or square pen tip.
To erase lines in the bitmap, select the ‘Retouching: Erase’ icon from the tool bar on the left side of the screen, or select ‘Retouching: Erase’ from the Drawing Tools menu. The eraser width and shape can be adjusted in the same way as the line thickness of the pen, as well as using straight or curved lines and a circular or square eraser.
Begin erasing by dragging the mouse over the lines you would like to erase. The retouching mode will continue until you select another mode or drawing tool, or until you press the escape key on the keyboard. You can only erase any lines fused to the bitmap. Therefore, if you wish to erase a part of a blue object or inserted image, you will first need to fuse them with the bitmap. You can read more in the manual section Working with fused bitmaps.
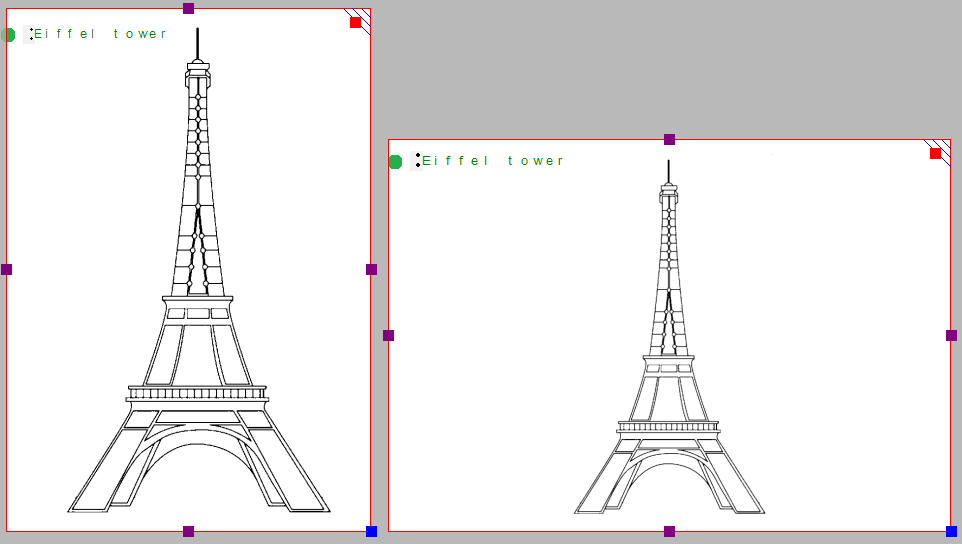
‘Retouching: erase’ icon: ![]()
‘Eraser width’ icon: ![]()
‘Use straight lines’ icon: ![]()
‘Free style (follow the mouse)’ icon: ![]()
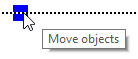
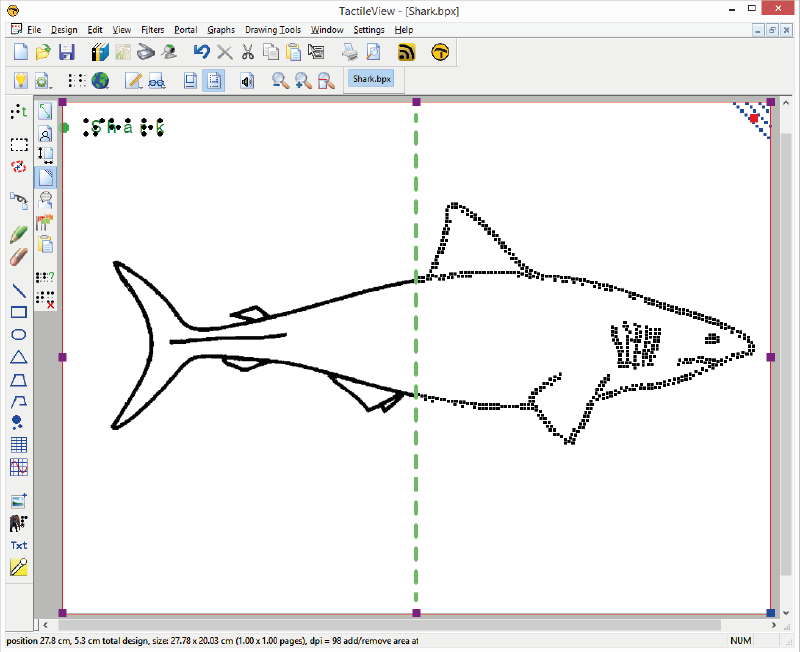
Figure 4. Using the eraser to retouch a section in the design.