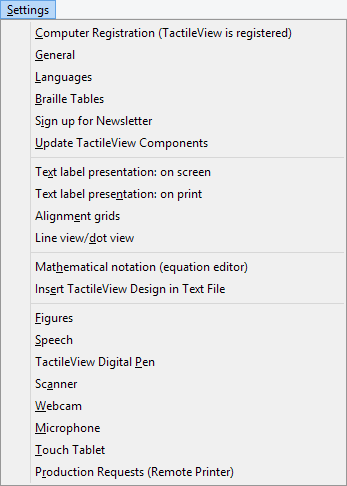
The configuration wizard leads you through the initial steps for setting up the software to accommodate your needs. However, additional options/dialogs can be found in the Settings menu. In this main menu, all the different settings of the software can be found, including those that are part of the configuration wizard.
Most option names will probably speak for themselves. Each settings dialog has an explanatory introduction that will help to select the best setup for you. The list below gives an overview of the functionality of each option in the Settings menu and provides a general description of the purpose for the menu items.
Computer registration
The software product code (SPC) has to be entered in the registration window. After selecting ‘Registration via internet’, your registration data will be checked on the TactileView website to verify the validity of the registration. Please note that each SPC is valid for only one computer.
Configuration wizard: step 1
General
The units for the preferred measurement system can be set, as well as the reference position for these measurements. The size of the markers that can be ‘grabbed’ with the mouse to modify objects can be adjusted. A marker size of 5 pixels is the default.
The internet gateway to the TactileView internet catalog can be tested and configured. The name and e-mail address of the author that is uploading designs to the catalog can be entered here. The TactileView Viewmaster will send feedback on the graphic aspects and tactile usability of the designs to this e-mail address.
Configuration wizard: step 3
Languages
The user language in which the software texts are displayed can be set, as well as the language in which the text labels are written in the design. Setting the text label correct language is important for uploading the designs to the catalog, as text labels are translated in all the available languages.
Configuration wizard: step 3
Braille tables
The conventions for texts in braille differ per country or language. Select a braille table as the main braille from the extended list of the Liblouis set of tables (includes contracted braille). When entering a text label in the design with the drawing tool ‘Add text label’, the braille characters will be automatically generated according to the selected braille table.
Configuration wizard: step 2
Sign up for newsletter
The Thinkable newsletter is a resource in which we announce events and share ideas about the usage of TactileView and various other products by Thinkable. Our regular newsletter is a great way to stay in touch with our work and everything that’s going on at Thinkable, so we invite you to sign up and leave your feedback.
Configuration wizard: step 3
Update TactileView components
Technically the software is set up as a modular system. The various modules, such as the software texts that you find in menus and dialogs, are stored and maintained on a non-public section of the TactileView website. TactileView will download any new updates automatically each time the software is launched. This setup offers great flexibility and convenience to provide minor updates without requiring any action, so it is advised to have this setting switched on. Please note that an internet connection is required to receive updates.
Configuration wizard: step 3
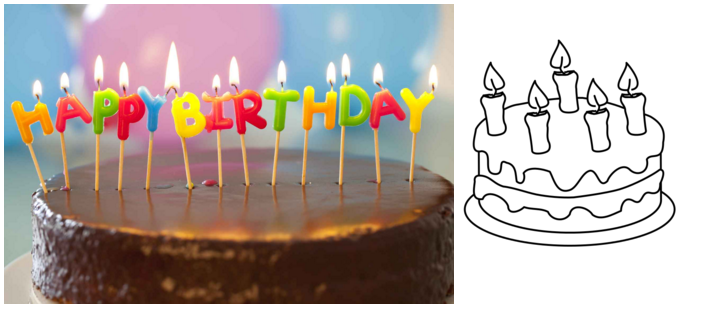
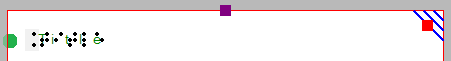
Text label presentation: on screen
The appearance of braille is quite different from the standard font and is hard to read for sighted users. Therefore the text that is added as a text label in the design can be displayed in standard font as well as in the equivalent braille characters, based on the selected braille table. The colour of the standard font (default green) can be changed or can be switched off completely.
Configuration wizard: step 3
Text label presentation: on print
Text labels printed on swellpaper can be represented both in braille and standard font, similar to the display on screen. The braille dots are printed in black. The visual font can be switched off or set to any preferred colour. For printing on swellpaper, make sure that the selected colour has no grey or black appearance.
Configuration wizard: step 2
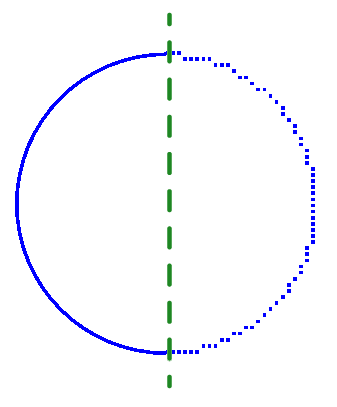
Line view/dot View
Depending on the selected embosser type, the positioning and distance between the braille dots will vary. During the design phase it might be easier to work with continuous lines. For a close check of the tactile layout it can be useful to switch to dot view. While switching from one mode to the other an explanatory message will be displayed.
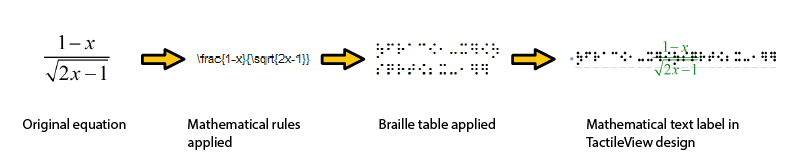
Mathematical notation (equation editor)
The MathType equation editor can be used to prepare mathematical equations in their spatial layout. The mathML expression is copied/pasted into TactileView. The equation can be expressed in braille using several mathematical notations. The preferred math notation is selected here.
Configuration wizard: step 4
Insert TactileView design in text file
TactileView designs can be embedded in documents that are produced with the Duxbury Braille Translator (DBT) See for more details also the section thirdparty software.
Configuration wizard: step 4
Figures
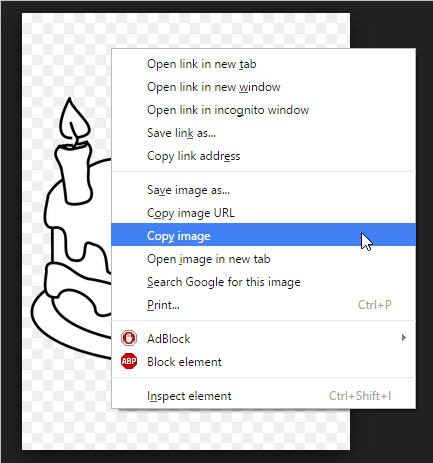
Arrows, electrical or chemical symbols, smileys, etc. can be added to the design as a figure by selecting the drawing tool ‘Import’, then choosing ‘Add Figure’. A library of figures is included, but new categories or figures can be added. In this settings dialog you can set the folder for your personal library of figures.
Speech
The Text-to-Speech engine (TTS) is selected in this dialog and performs two tasks.
The TTS vocalizes the software messages to support the use of a screen reader and is announcing the text that is supplied in the audio style for an object.
A design, once embossed, is called tactile diagram. In addition to the tactile information, an extra layer of audio information can be added to the design. Specific areas can be provided with an audio style (See also Editing object properties). The TTS is used for when exploring the audible information in a diagram.
TactileView digital pen
The TactileView digital pen acts as a connection between the software and the TactiPad drawing board or the TactileView ClickPad. For both setups, the software is providing additional functionality in combination with the hardware. Attention has to be payed to the position of the receiver and the calibration. The usage for this setup is targeted for visually impaired users of the digital pen and requires a high skill level.
See also the sections TactileView digital pen, TactiPad and ClickPad
Scanner
When a scanner is connected to the computer, it can be configured in this settings dialog. Select the option ‘Quick scan with scanner’ from the Portal menu or click on the scanner icon in the top toolbar to start the scanning process and insert the scan in the existing design or in a new document. For further processing use the drawing tools from the drawings tools icon bar.
Webcam
When the computer is equipped with a built-in webcam or an external one, select ‘Activate webcam’ from the Portal menu or click on the ‘Activate webcam’ icon in the top toolbar to start the webcam. The resulting image can be inserted in the existing design or in a new document. For further processing use the drawing tools from the drawings tools icon bar.
Microphone
The built in microphone or an external one can be configured for adding recordings as an audio style to an object. See: Editing object properties.
Touch tablet
A touch tablet can be connected to explore audio tactile diagrams. The settings are configured in this settings dialog. See also the section ‘Audio tactile diagrams’.
Production requests (remote printer)
Not everyone has access to a production facility (swellpaper or braille embosser) for tactile graphics. In combination with the TactileView website, printers can be made accessible for remote printing by other users. This feature requires a software and printer installation that is made available to others as a so-called production facility.
To upload your production requests to a remote printer, a customer code and teleprint code are required to keep track of which design has to be produced on which embosser for which customer.
For the production facility, a customer code and an printer identification code are required to retrieve the production requests from the TactileView website.
 Previous section
 Return to TactileView manual overview