In version 2.500, the emphasis lays on new features that will help you to get the best layout in your designs. Below you will find a more technical description of the changes that were made. To understand how these affect the functioning of the software, we recommend you to read the modified, extended and newly added manual sections.
Important technical changes
– A new technique is implemented to ensure the computer identification leads to unique and secure registration. This requires you to re-register. The version indication will change; future versions will have only numbers like 2.50.00.10
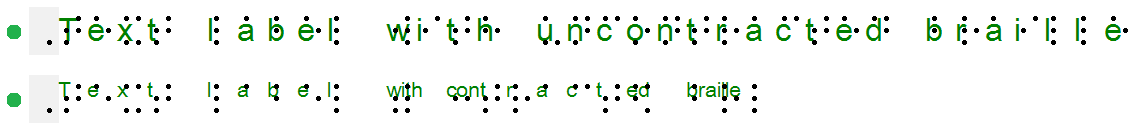
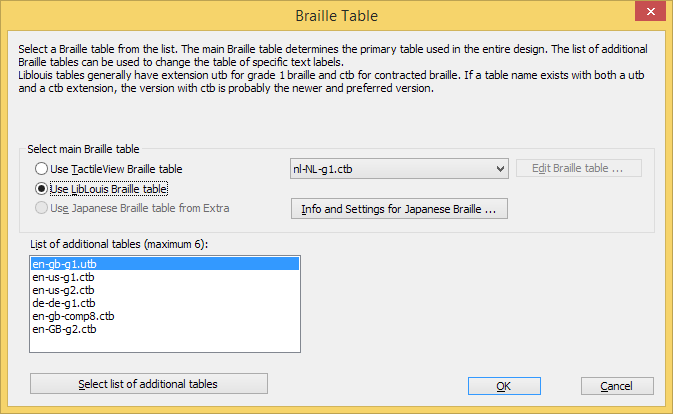
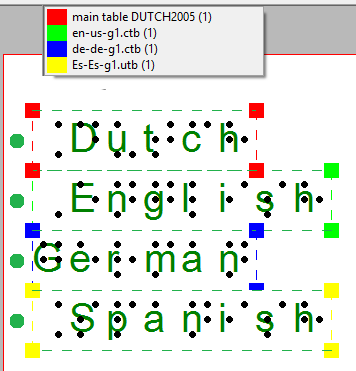
– The Liblouis braille table engine 3.17 is implemented. The many braille tables for different languages supported by Liblouis allow for replacing the TactileView braille tables. When registering the software you will be asked to select a Liblouis braille table as your main braille table. Documents created with TactileView braille tables will be converted to use Liblouis equivalent brailletables on opening.
Improvements and extensions
-Images in the TactileView catalog have a unique number referred to as image ID. After download of the image from the catalog, this image ID will be included/printed as part of the design. The default position can be changed in the context menu / design elements.
Entering this image ID on the ‘TellID’ page will bring up the description for the particular image.
For screen reader users the description provides additional information related to the image.
– The portal menu Create map is repaired and works in combination with the newly built Route tactile website (www.routetactile.com)
– The front-end and back-end for the TactileView website has been made more secure by a transition from HTTP to HTTPS protocol including software and website interaction.
– For downloading files from the TactileView website a new method has been implemented, resulting in a more smooth proces.
– The page to download an image from the catalog contains less navigation elements and the download button is combined as part of the image. The selected image will automatically feed into TactileView. For maps from the RouteTactile map creation system a similar mechanism is implemented.
– The motorised drawing arm (MDA) product is supported. See for product information MDA. For a manual see MDA manual.
– A new tool ‘Colour substitute’ is introduced. This tool can change areas with the same colour into textured tactile areas, as configured in custom profiles. It also allows to change colours in alternative coulours or to add audio styles to colours. Custom profiles can be created, modified or deleted in the settings menu. Colour substitution works with bitmap images such as JPG, PNG, TIF and GIF.
– The tools Filters, Detect shape, Colour substitute and Draw graph are extended with a hints section in the toolbars and context menus respectively.
– When launching the software a ‘Blind access’ message will pop up, providing hints on how to operate TactileView using a screenreader.
– The object list is extended. Each object can be provided with an alias/ text description for easy identification for screenreader users via the toolbar/context menu or via the object list. Object properties, including the object alias, are presented in columns which can be sorted. The elements in the object list can be modified via their context menus. Individual objects can be sketched with the MDA to support incremental drawing of an entire design.
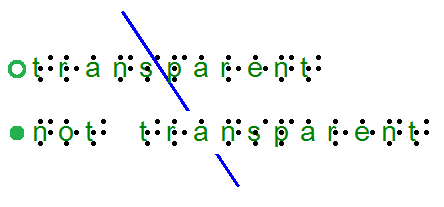
– Object markers and label type markers have a transparency setting in menu general to ease aligning objects and textlabels.
– The maximum size of the characters that can be created with the drawing tool Letter and numbers is now set to a higher value of 400 pixels. This works only for fonttypes that allow for scaling.
– Circle objects can have a tactile centre indication, as well as a centre textlabel indicator.
– The draw graph tool is extended with a logarithmic scale type. More example grids have been added and categorised in the respective scale types (linear, logarithmic, degrees and radians) and separated in sub categories design orientation (landscape/portrait).
– The selection tool has an additional function that allows to eliminate the surplus of white space. The selected area will shrink, only the content is retained. It helps to position the content. Once an area is selected, it has to be de-selected before using other tools.
– Tool tips and mouse shapes are optimised.
– The Language reset icon is modified and in the language setting dialogue a button ‘set language to English’ is added in order to reset the software interface to English.
– The texture fill preview now shows the true size of the texture once printed in the selected measurement units (centimeter/inch). The input of the texture size is improved.
– All dialogs containing settings for measurements have the indication of the selected unit of measurement as set in the Settings menu / General (pixel, inch or centimeter)
Lay-out aspects
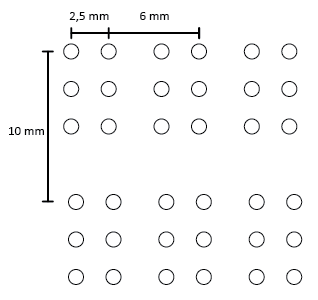
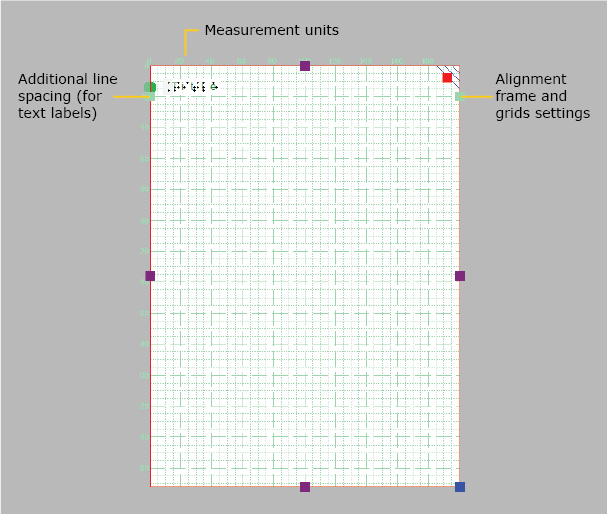
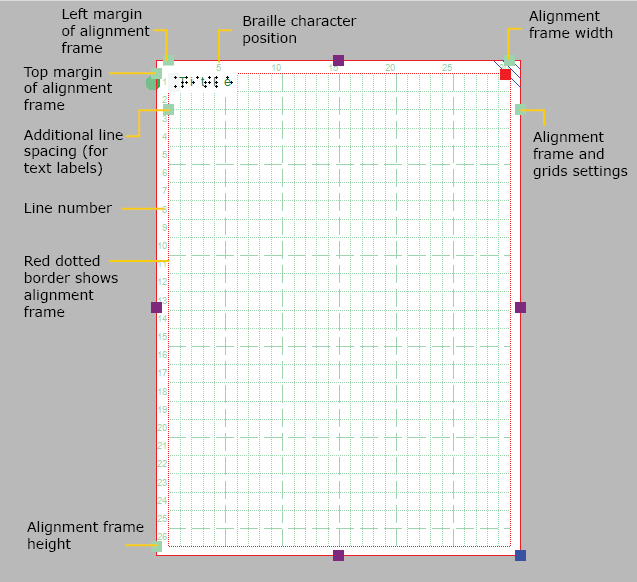
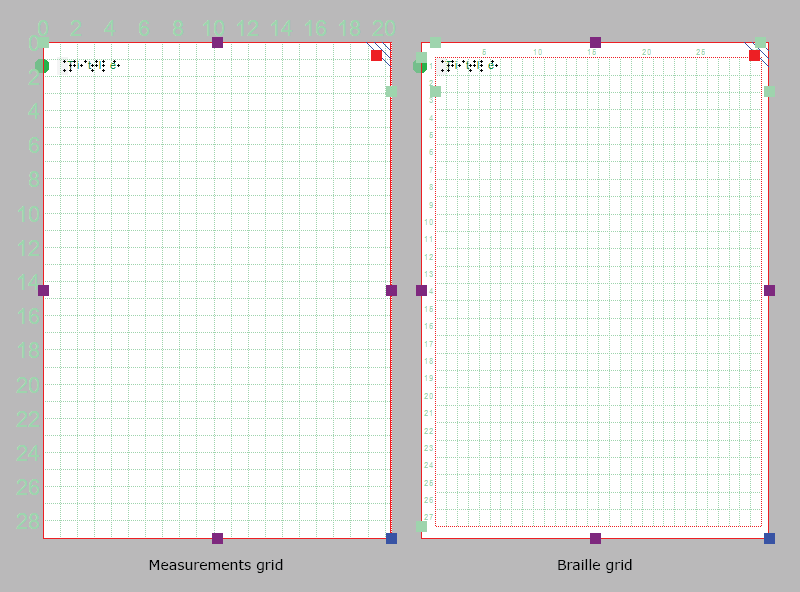
– This version sees the introduction of the new braille grid and enhanced measurements grid. These are shown in light green on screen and are used for convenient and accurate alignment of braille texts or object in your design. The size of the alignment grids can be limited to a specified area in the design by enabling the alignment frame. See the manual section Alignment frame and grids for more details.
– TactileView supports a wide range of different embossers, resulting in a vast number of different paper sizes and their corresponding printable area for the particular printer. Therefore, when opening a saved file or a design from the TactileView catalog, the design size would not necessarily match the paper size. Moreover, changes in design orientation would also lead to a design that would not match the paper orientation and had to be adjusted manually to make it fit.
In the new release version, the design will be adjusted automatically in all of these cases. When the design is too large in any direction, any excess white space around the edges will now be trimmed automatically; if the design is too small in any direction, the design will be extended to match the paper size. Note that this will not affect the contents of the design.
See also: Changing design orientation and size and Paper size vs. design size.
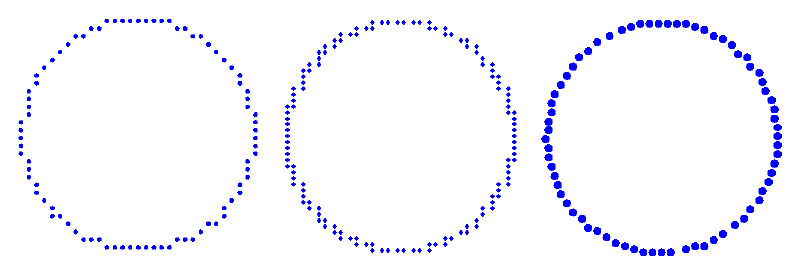
– The dot view mode has been adapted for better accuracy and reduced delay when editing the design. Colours are depicted in greyscale for ViewPlus to display variable dot height. For Index and Brailletec embossers, the positioning is improved to avoid overlap (less chance of tearing the paper). The unintended overlap of white space behind text labels with adjacent objects has also been solved.
See also: Design mode: dot view/line view.
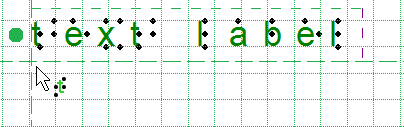
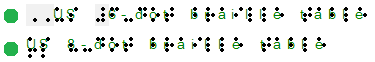
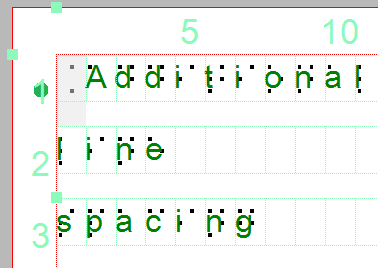
– Composition signs such as capital signs and number signs are now indicated with a light grey background, to notify the designer of the space these signs occupy. This is especially useful when the braille is hidden on screen, when previously only a blank space would be visible.
See also: Braille tables – Inherent braille properties
– Imported images and figures (‘Import’ option from the left vertical toolbar, previously ‘Add figure’) are no longer placed in the top left corner of the design, but will be placed at the desired position by clicking in the design after selecting the image.
See also: Import (image from file, svg and figure)
– An inserted image can now easily be replaced by selecting ‘Replace with image on clipboard’ from the properties toolbar of a selected image. This will replace the current image with the image file on the clipboard, retaining the original position and corresponding to the size of the original image.
Other improvements
– A new drawing tool for creating curving lines and shapes has been added, which gives you full control to create any desired shape. ‘Draw Path – Curved Shape’ can be found in the left vertical toolbar and incorporates the previous drawing tool ‘Free-hand line’. As this is now used to draw curved objects, the Polygon tool has been simplified to only include straight lines. For a full explanation of this drawing tool, see .
– The latest up-to-date braille tables have been implemented with Version 3.0.0 of the Liblouis braille translator. This new version includes support for UEB. Some of the braille tables have been updated and require you to select a replacing braille table; TactileView will automatically guide you in choosing the correct new table.
– The objects ‘Draw letters and digits’ and ‘Mammoth braille’ can now be edited by double clicking after they have been placed in the design.
– When processing production requests (teleprinting), the original braille table(s) of the document can now be retained. When opening the production request, you will be prompted with a choice between changing text labels to your own main braille table, retaining the original tables or saving the braille table of the document as your main braille table.
– The dialog for entering or editing a text label has been extended with information about the number of braille characters and lines of text. This is especially useful when operating TactileView with a screen reader.
– Tooltips have been added for convenient adjustment of the word wrap (text label width) in the design. The marker allows for dragging the word wrap length to any position before entering text.
– For new text labels, the last used braille table is selected. To avoid confusion, after closing and relaunching TactileView, your main table will now be used for new text labels instead of the last used table in your previous design session.
– Other text label improvements: empty labels are removed automatically; the position in the design is more stable when editing the word wrap length; you can use Ctrl+Home and Ctrl+End to navigate to the beginning and end of a label.
– The purple markers on the corners of the design have been removed, as all functionality is already available with the remaining purple markers on the sides and blue marker on the lower right corner.
– Importing svg images has been improved to extend the range of supported elements.
– The status of the right-up marker (enabled or disabled) will now be saved in TactileView designs.
– The drawing tools in the left vertical toolbar can now be activated with keyboard shortcuts. The list of shortcut keys can also be edited via Settings > Keyboard shortcuts. See: Keyboard shortcuts.
– The Shift key can be used for accurate positioning of objects and text labels by moving them only horizontally or vertically; in the new release, this will also include diagonal movement (i.e. the positioning can thus be restricted to multiples of 45 degrees). This also works for moving individual anchor points in polygon or path objects.
– The table object has been revised, whereby adding or removing rows/columns has been simplified and menu driven design for tables has been improved.
– The line textures for objects have been improved to give better tactile results as well as a more convenient line style dialog.
Printing aspects
– Important: Duxbury Braille Translator (DBT) requires a service update in order to support the Index V4 and V5 with high resolution graphics. Selecting ‘Check for Updates’ from the Help menu in DBT will bring you to the required updates (under Supplemental Downloads).
– Support for the Brailletec Puma, as well as the ViewPlus EmBraille and Columbia embossers has been added.
– Variable relief height has been clarified when a document is opened with an embosser selected that does not support different dot heights.
– Printer driver installation (File > Install braille printer) has been simplified to include clear instructions for all supported embosser models.
– The method of positioning of the braille dots for the range of Index embossers has been revised. The resolution has been doubled (from 50 to 100 DPI) and the algorithm has been enhanced. This has resulted in a higher accuracy for the tactile graphics produced on an Index embosser.
– Paper tearing that occurred with Index embossers has also been addressed. This happened mostly in designs with thicker lines, causing the braille dots to overlap. This weakens the paper and causes it to tear. By revising the dot placement algorithm, this has now been significantly improved.
– Designs were previously rotated unintentionally when printing on 11,5×11 inch paper. This has been fixed in this release by limiting the orientation of designs to portrait for this specific paper size, as the 0.5 inch difference in height and width is negligible.
– The printable area for the 8.5*12 inch paper size has been decreased slightly to avoid the printing of a blank sheet as part of the document.
– Index has released an important new version of the firmware for their V4 embossers; see the Index website for download and instructions. Make sure to update your V4 embosser, as this release solves a number of printing issues that also had their effect in TactileView:
• The printable area for the 8.5*12 inch paper size has been decreased slightly to avoid the printing of a blank sheet as part of the document.
• When printing a design on A4 or , ‘Error 213’ could occur; this has now been solved. TactileView also provides a temporary solution for V4 embossers to avoid this error when the firmware has not been updated yet.
Bug fixes
– Altitude lines in triangles will always be shown, even for obtuse triangles, when selected.
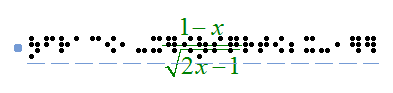
– Empty formula labels are no longer shown above graphs.
– The order of the values along the axis of an empty mathematical grid has been fixed.
– Some problems when launching TactileView without internet access solved.
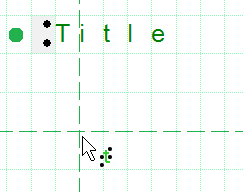
– Capital sign in title text label is now displayed correctly in a new document.
– When a text label was selected, the right-up marker could not be operated; this has now been fixed.
– You can now correctly select, overwrite and navigate within text when editing a text label in the design. You can also select text by dragging and selecting with the mouse.
– Some issues with placing or moving the caret to edit a text label have been solved.
– Text label transparency is now retained in a saved document.
– The caret position has become more accurate for editing a rotated text label in the document by double clicking. Please keep in mind that not all embossers support rotated braille text retaining the default distance between the braille dots.
– Drawing a polygon has been improved when the polygon is rotated.
– A number of drawing tools, such as circles and triangles, no longer functioned correctly via ‘Menu driven design’ or the Drawing tools menu; these issues have been fixed. All options for drawing a graph are now also available via ‘Menu driven design’.
– Error when applying filters to an image copied from Microsoft Paint (or any other 24 bit image) has been solved.
– When the text label tool was selected, the braille table could be selected prior to placing a new label. For regular text labels, the braille table did not always match the table that was ultimately used for the label. For labels with braille keyboard input and certain input method for mathematical text labels, braille table selection was not applicable and is no longer shown in the respective properties toolbar.
– The drawing tool ‘Detect shape’ has been improved so the properties such as line style or fill style will be preserved when readjusting the detection criteria.
– The registration procedure has become more efficient and intuitive.
– Text label alignment did not function correctly when the title label was deleted.
– Some drawing tools (Filters, Graph and Import) could not be deselected with the Escape key.
– The output on some embossers for the small ticks along the axes of a graph has been improved.
– The size and position of ‘Letters and digits’-objects will no longer be distorted after saving or scaling the design.
– The default green indicators in a triangle that mark the corners, equivalent angles and right angles are no longer fused when the triangle is fused with the bitmap.
– The Select Area tool has been extensively reworked to improve functionality such as copying, cutting, moving and deleting the elements within the selection.
– When the visibility of the line is set to ‘White line’ or ‘None’, a red dashed line now used for all objects to signify their presence.
 Previous section
 Return to TactileView manual overview