Skip NavigationMenu

Creating Graphs with TactileView Software Tutorial

Learn how to create mathematical graphs with coordinate systems and grids that are suitable for tactile graphics

Introduction: Graph and Grid

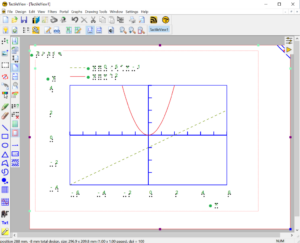
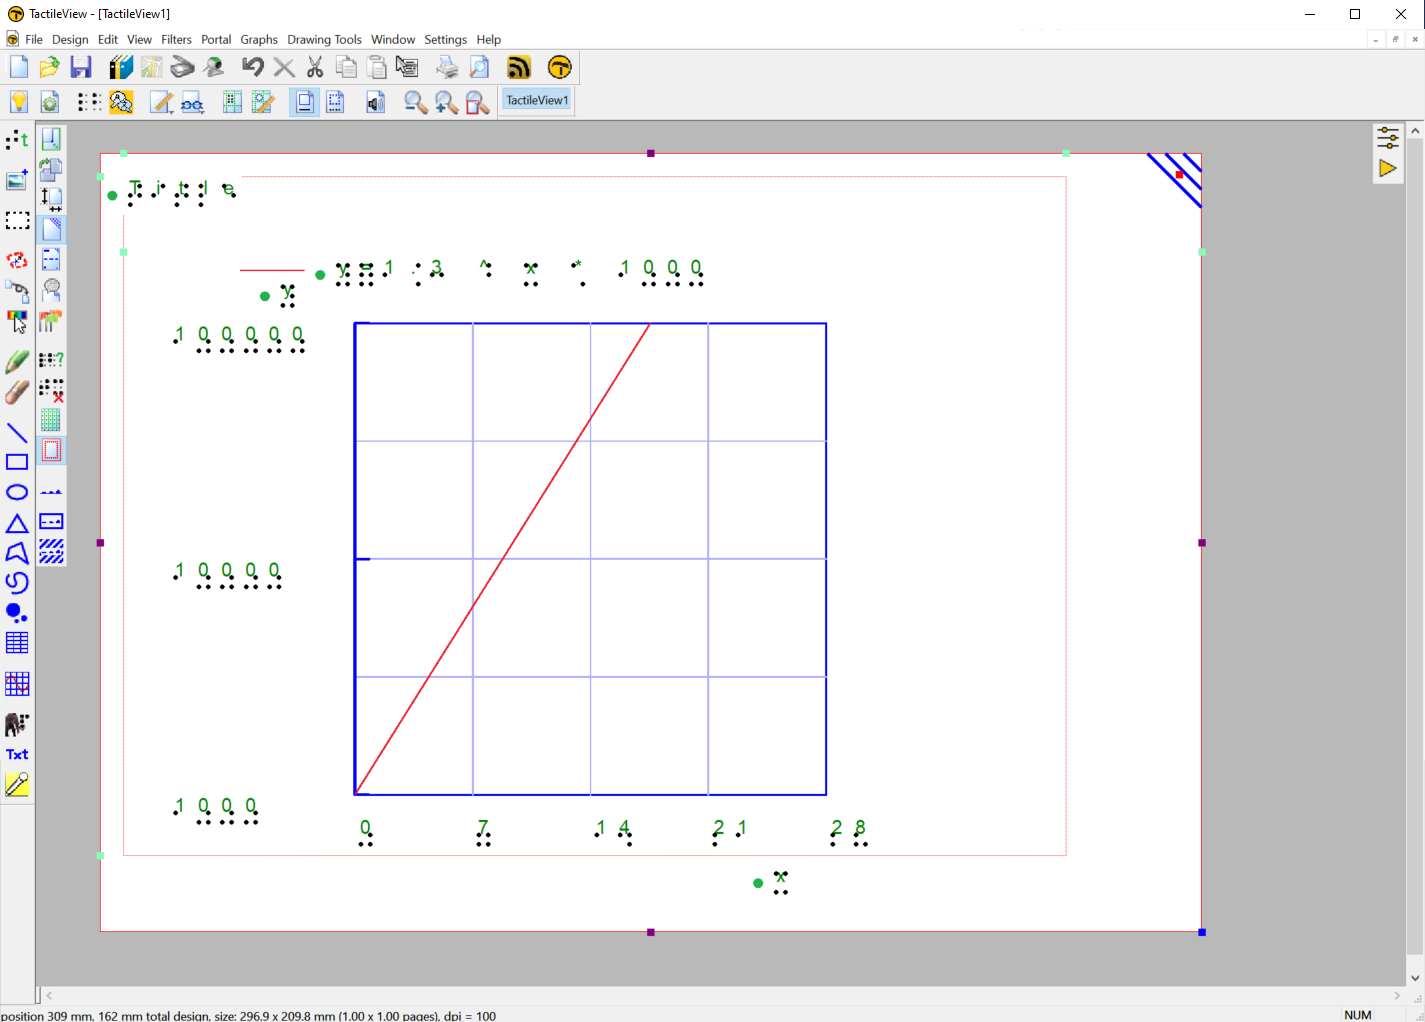
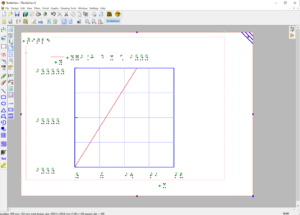
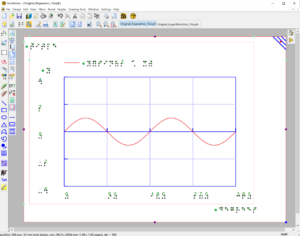
The TactileView drawing tool ‘Draw graph’ has a large number of examples for grids. A complete grid consists of the axis setup, formula(s) and tactile appearance settings. Selecting an example and modifying this will get you in a few steps to a tactile usable graph that can be produced on swell paper, a braille embosser or on the motorised drawing arm (MDA).
Produced in braille or on swell paper, it also will present the text labels for the formula in different mathematical braille notations.
External math software such as MathType that uses MathML file format can be used to import a formula to have this plotted in a graph


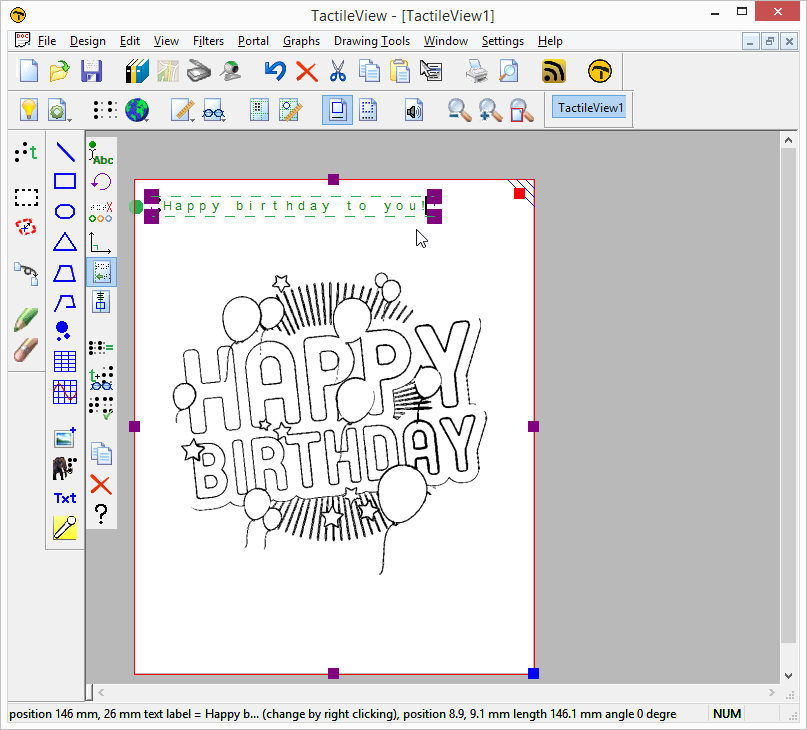
(((Placeholder for a picture containing both the tv screenshot and a photo of the printed, sketched and embossed version of the graph)))


‘Graphs’ menu: Many options to chose from

The item in the main menu ‘Graphs’ and the icon in the vertical tool bar ‘Draw graph’ both bring up the same range of features to create a graph with ease. Ease is still a relative concept; to obtain a tactile usable graph quite a number of aspects has to be thought through. Over 30 parameters can be set to design the axes, graph(s) and overall appearance.

Chicken–egg dilemma in tactile drawing with software

When you know what kind of formula you need to have plotted in a graph, you have aspects like the type of the scale, the range and texts for the axis etc. already in mind as well. In other words, do you want to compose the axis setup first (as you would do on paper) so you can add the formula in a second step? Or do you want to enter the formula first (what you can actually do in software) and afterwards adapt the axes fitting the produced graph? With this latter approach you have to be concerned about all the aspects that make the grid a tactile usable diagram.

Solve the dilemma: Grid examples as a starting point

The TactileView software has a number of examples with preset values available for graphs of various types. There are examples for coordinate systems (grids with just the axis settings) and also a number of examples that contain a single formula or even multiple formulas.
A modified example grid can be stored as a ‘MyGrid’ for future use.

Learn how to create three different axis types in this tutorial

The following three worksheets will show you step by step how to create a grid with a linear axis scale, a logarithmic one or using degrees and radians as units.


Worksheet 1: Linear scale


Worksheet 2: Logarithmic Y scale to represent the Covid19 infection cases


Worksheet 3: Scale in degrees or radians for goniometrical functions

Tutorial 1: Creating a tactile design based on an imported image

In this tutorial we will show you the basic steps how to convert an existing image file into a TactileView design that is suitable for tactile use. Some images require less editing than others, so in many cases you can simply skip some of the 12 steps below.

As an example in this tutorial, we will show how to create different tactile birthday cards. Below, we will show how to edit an image from the internet, but any digital image file can be imported as a basis for a tactile design, including a scan from a book, a webcam image or a saved image file from a digital document. The further steps of editing the image will be identical, regardless of the image source.

You can follow along with the video or scroll down to read the step by step guide.


Step by step guide

1. Finding a suitable image (Google image search)

Using Google Image Search to find a suitable image. In this example, an image of a birthday card is selected.

1.1 Use Google Image search to find your image. Go to Google Image search and type in the keyword(s) of the image that you wish to convert. Try different keywords if you cannot find a suitable image, e.g. ‘Mercedes logo’ instead of just ‘Mercedes’. In some cases, using English keywords may give more results than in other languages. Adding ‘drawing’ or ‘clip art’ to the search may also give better results.
See also: Importing images from the internet >


Using the Search Tools in Google to refine the image search, for example by selecting 'line drawing' as image type.

1.2 Refine the Google search results if necessary. Select Search tools > Type > Line drawing for more suitable images if necessary. In general, line drawings or vector images are more easily converted to a tactile image.
See also: Importing images from the internet >


Copying the image in the web browser.

1.3 Select and copy or save the image. Once you have found the right image, select it and right click > Copy image; alternatively, you can right click and save the image on your computer if you wish to save it for later use.
See also: Importing images from the internet >


2. Importing the image in TactileView

Opening a new design in TactileView.

2.1 Create a new design in TactileView. Launch the TactileView software and open a new file.
See also: After launching the software >


Pasting the image of the birthday card in the TactileView design.

2.2 Option A: Paste the image in the design. If you chose to copy the image, you can right click in the design area and select ‘Paste’ to place the image in the design. Alternatively you can use Ctrl+V or click on the ‘Paste’ icon in the top toolbar.
See also: Importing images from the internet >

Option B: Import the image from file. If you chose to save the image, select the ‘Import’ icon from the drawing tools toolbar and choose ‘Import image from file’. You can also find this option in the File menu. Browse to the file, select ‘Open’ and click on the position in the design where you wish to insert it in the document.
See also: Importing images from file >

2.3 Resize the image. Make sure that the image is large enough for tactile use and fits well within the design, leaving small margins around the edges. Use the purple markers on the corners and sides to resize the image.


3. Editing the image for tactile use

Applying an overall filter to the imported image to convert it to a line drawing that is suitable for tactile use.

3.1 Apply an overall filter to make the image suitable for tactile use. Filters help to reduce the complexity of images and filter out the tactile suitable graphic information. In this example, the filter ‘Convert to line drawing’ with a setting of 25 is applied.
See also: Filters; editing an imported image >


Applying a local filter to enhance the tactile properties in a selected area.

3.2 Apply local filters to adjust a selected area. Some images might require some additional, local adjustments for optimal usability.
See also: Select area; editing parts of the design >


Removing unwanted elements with the eraser tool.

3.3 Retouch the image. Select ‘Retouching: erase’ or ‘Retouching: adding lines’ from the drawing tools toolbar or Drawing tools menu to retouch the filtered image. Use the eraser to remove any unwanted elements or use the pen to fill in any missing parts of the image.
See also: Retouching tools; pen and eraser >


4. Adding explanatory text

Editing the title text label gives a first description of the image.

4.1 Edit the design’s title label. This text label gives the first description of the design’s contents.
See also: Add text label >


The text

4.2 Replace or clarify any texts in the image with text labels. Use the eraser to remove the existing visual text or add lines that refer to the visual text. Select ‘Add text label’ to insert text labels in braille to replace or clarify the existing texts.
See also: Add text label >


Additional text labels indicate the position of some balloons on this birthday card.

4.3 Add extra text labels required for interpreting the image by touch. These additional labels can make the image easier to interpret for the VIP reader.
See also: Add text label >

Tutorial 2: Editing challenging images

In the first tutorial, we covered how to produce a tactile graphic based on an image file by applying one or more image filters. However, not all images are suited for this method, and an adequate image might not always be available. In this tutorial, we will show the most effective way to produce a tactile graphic based on an image file when filters will not do the trick.

Reasons why filters might not work

In the manual section Importing images from the internet, we describe how to select an image that is most suitable for conversion with filters. However, suitable image files are simply not always available. For example, the quality of the tactile graphics can differ based on the level of detail – too much detail, and the elements are no longer distinguishable by touch; too little detail, and the subject might not come across clearly. In other cases, elements such as texts, colour gradients or shadows might disturb or complicate the tactile graphic. When an alternative, more suited image is not available, you will have to carry out additional editing to produce a good quality tactile graphic.

Tracing the image

With the Draw path – Curved shape tool that is introduced in TactileView version 2.500, it is easy to trace the required elements in an image. You can accurately match the curves and shapes in the images that you wish to present in the tactile graphic. Another added benefit of this method is that the path is an object (as signified by its blue colour), which means that you have full control over properties such as line style and can scale the elements to any size if required.

To see how we edited an image using the ‘Draw path – Curved shape’ tool, watch the video or scroll down for step by step instructions.


Step by step guide

1. Import the image

Import the image file in the design

Place the image that you wish to use in your TactileView design by selecting ‘Import’ from the drawing tools on the left, then select ‘Import image from file’. Resize the image to suit the selected paper size. In this tutorial, we will use a map of a cruise holiday as an example.

2. Tracing elements in the image

Tracing the elements in the image

Choose which elements you need to trace in the image to convert it to a tactile graphic. In our example, we will be tracing the contours of the coastline as well as the route of the cruise. The coastline of the islands will be traced as a separate element.

To start tracing the elements in the image, select the ‘Draw path – curved shape’ drawing tool from the drawing tools toolbar and choose ‘Click and draw (Bezier curve)’. Position the cursor at the start of the line, then click and drag to place the first anchor point. The direction in which you drag determines the direction of your curved line. Move to the first point along the line where it changes direction and place the next anchor point by clicking and dragging.

3. Finishing the traced line

All elements in the image have been traced

Once you have placed all the anchor points along the line in the image, click on the green semicircle that is visible next to the last placed anchor point.

4. Remove the image file

Removing the image

Once you are finished tracing the image, you can remove it again by selecting it and pressing the Delete key.

5. Refining the lines

Refining the traced lines

You can always refine the contours of the line that you created by adjusting the green handles at the anchor points. For the best accuracy, it is best to switch to ‘Design mode: dot view’ in the lower horizontal toolbar to check the exact positioning of the braille dots.

6. Apply braille text labels

Adding text labels to clarify the map

Most tactile graphics gain a lot of clarity by using text labels to mark the different elements in the image. In our example, the cities along the route are labeled with numbers in the map, with the city names listed below.

7. Applying line styles and other properties

Applying line style to the line of the cruise's route

Once the elements of the image are traced, we have the added benefit that we can apply a range of properties to the different sections of the image. In our example, we can give the route of the cruise a different line style to distinguish it from the lines that mark the coastline. To do this, select the curved line object of the cruise route, then select ‘Line style’ from the properties toolbar and select a line style.

You could also choose to fill the land in the map with a texture to make it easier to feel the difference between land and water.