Skip NavigationMenu

7.03 Braille tables – Inherent braille properties

In braille, many different conventions and variations are used. Below, you will find an overview of the aspects of braille that are supported in TactileView. By using text labels in TactileView with the correct braille table selected, in-depth knowledge of braille to still produce correct braille texts is not required. However, below you will find a list of the most prominent inherent properties of braille script that determine the layout of braille text labels in your designs.

Braille cell size, white space and composition signs

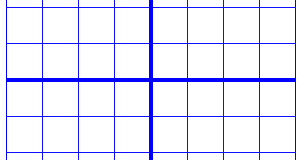
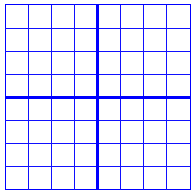
TactileView automatically ensures the braille is sized correctly (following the most commonly used distance of approx. 2,5 mm = 1/10 inch between braille dots) as well as using the correct distance between braille characters (approx. 6 mm) and lines of text (approx. 10 mm). A white space around the braille makes sure that there is enough space between adjacent objects or texts to ensure they can easily be distinguished with your fingertip. The braille grid can be used as a layout tool for alignment using these standard dimensions, see Braille grid (text alignment).

Other aspects that are specific to braille such as braille composition signs (capital letter sign, number sign, symbols, etc.) are also applied automatically. These composition signs are highlighted on screen with a light grey background. Remember that these composition signs differ significantly between different languages and braille tables.

Braille cell sizes visualised: distance between dots within a character (2,5 mm), width between two characters (6 mm) and two lines of braille text (10 mm).

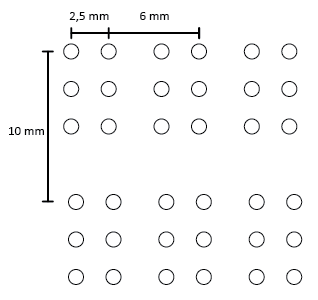
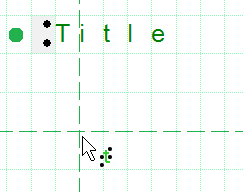
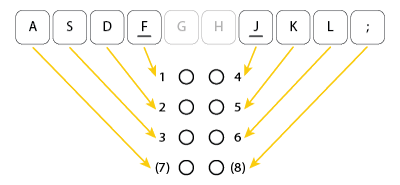
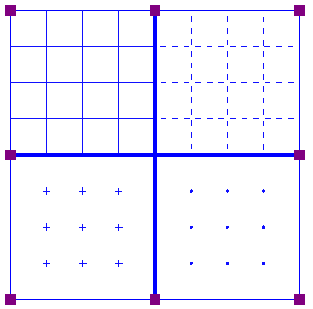
Figure 1. Braille cell sizes.

Composition signs (capital, number, etc)

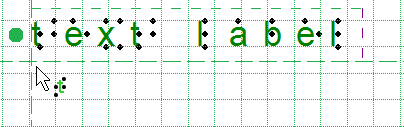
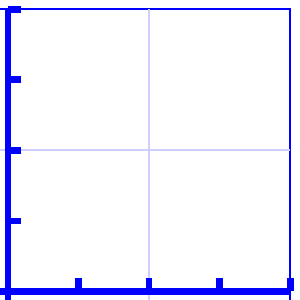
Figure 2. Capital sings as an example of composition signs; the rules for these signs vary between different languages and braille tables.

Six dots and eight dots

With the introduction of refreshable braille displays, two extra dots were added to form 8-dot braille. This way, using 255 braille characters are available (not including the space character) instead of the regular 63, allows a larger range of characters to be denoted in braille, such as mathematical symbols. Other notable differences with 6-dot braille are found in the braille composition signs.

For more consistency, braille display users that are familiar with reading 8-dot braille can use an 8-dot braille table producing designs from TactileView as well. Text labels (including the white space behind the braille) will automatically be higher to accommodate the addition of the two extra dots.

Comparison between 6-dot and 8-dot braille

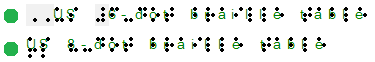
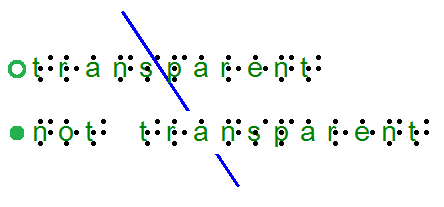
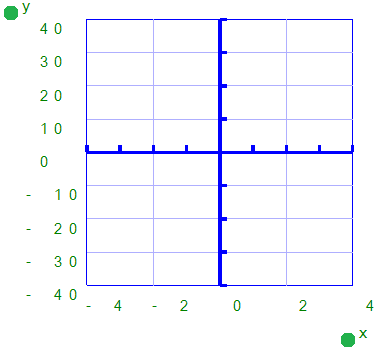
Figure 3. Comparison between 6-dot and 8-dot braille (example: LibLouis tables en-us-g1.ctb and en-us-comp8.ctb).

Uncontracted (grade 1) versus contracted (grade 2) braille tables

To save space in an embossed braille document, frequently used syllables or entire words can be represented by a shorter combination of braille character or even a single character. This is called contracted braille or grade 2 braille.

As an example, the word ‘the’ would be denoted with three braille characters in uncontracted English braille. In contracted braille however, this is shortened to just a single character.

When using a contracted Liblouis table, these contractions and abbreviations are applied automatically. The reader must be familiar with these conventions to be able to read contracted braille. On screen and when the design is also printed in ink, the font size of the visible text is reduced to match the text position with the braille characters.

Comparison between contracted and uncontracted braille

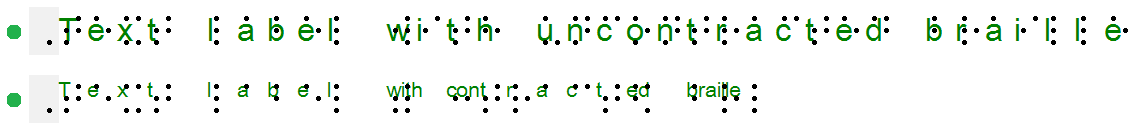
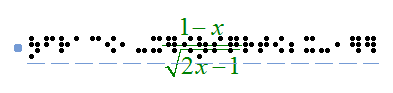
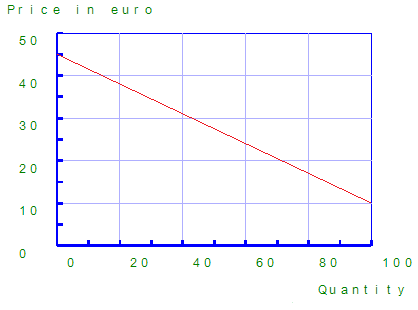
Figure 4. Length difference between contracted and uncontracted braille.

7.04 Text label – Computer keyboard input

To read a tactile diagram with ease, it is very helpful to add text information to the design. For example the different parts of a flower or rooms in a building can be labelled in the design to add descriptive information to the image.

Once the text label is added to your document, it can be edited at any time; see Editing text labels. For the other input methods for text labels, see Text label – Braille keyboard input and Text label – Math input.

Text label placement
To place a text label, click on the ‘Add text label’ icon in the drawing tools, then move the mouse to the desired position in the design and click again. You can start typing right away or use Ctrl+V to paste a copied text.
A text label can be positioned anywhere in the design. Leave enough space around texts labels to ensure the braille dots can be distinguished easily, so make sure that text label are not too close to lines in your design. This way you will maintain optimal tactile usability.

When placing a text label, the width of the text label is automatically adjusted to fit within the sheet of paper or within the alignment frame when this is enabled.

Add Text Label icon: Icon for placing a text label

Text label placement

Figure 1. Click in the design to place a text label.

Precise placement: centre or align (snap)
Two functions in the options toolbar allow for more precise placement of text labels. The ‘Centre’ function will horizontally place the label in the middle of the design.
With ‘Text label alignment’ turned on, text labels can be aligned with previously placed labels. Green dotted lines appear in the design when placing or moving a label close to the vertical or horizontal position of other labels. The text label you are adding or moving will then snap to the green line.

You can also use the braille grid as a layout tool for alignment of text labels throughout the document.

Text label alignment icon: Text label alignment icon
Centre text label icon: Icon for centering the text label

Green lines indicate text label alignment

Figure 2. Text label alignment with green dotted lines.

Adjusting label dimensions using word wrap length
Word wrap length is the maximum number of characters per line of text in a text label. For example, a word wrap length of 10 will divide a text of 25 braille characters into three lines of text. Line breaks will be placed at the position of spaces to avoid breaking up words. The lines of braille text have a fixed height that matches the standardised height of embossed braille text.
The word wrap length can be adjusted by dragging the sides of a text label. The tooltip will display the value of the word wrap length. Alternatively, select ‘Text and position’ from the properties toolbar or context menu of the selected text label to enter a value for the word wrap length.
Adjusting word wrap length by dragging the sides of the text label

Figure 3. Adjusting the word wrap size by dragging the sides of the text label; the tooltip signifies the word wrap length.

 
Text label presentation on screen
The text label is presented on screen by a combination of green characters with black dots that represent the braille characters that will be printed on the braille embosser or on swellpaper. With this setup you are able to have an eye on the braille characters. You can change how text labels are displayed on screen by selecting ‘Text label presentation: on screen’ in the toolbar or via the context menu.
Text label presentation on screen icon: Icon for Text label presentation: on screen
 
Automatically correct braille: braille tables
The guidelines (so-called braille tables) for how texts are displayed in braille differ internationally. By selecting the correct default braille table via Settings > Braille Tables, the braille in your text labels will automatically be correct. This means that you do not need to have any knowledge of braille to get accurate braille in your designs. For example, braille composition signs for capital letters or numbers are automatically included.
.
 
White space behind labels (transparency)
By default, labels have a white space behind and around the braille text to ensure that other design elements do not interfere with the braille. Keep in mind that lines can be covered by the white space if the label is placed too close.
By switching off the white space (making the label transparent) you are able to place the text label on top of lines, but make sure they do not disturb the braille.
‘Add/remove white space’ icon: Add or remove white space

Text label transparency

Figure 4. Difference in text label transparency; notice that the line is visible below the top text label, but is covered by the white space of the second label.

7.05 Text label – Braille keyboard input

There are three input methods for text labels; for the other two input methods, see Text label – Computer keyboard input and Text label – Math input.

The computer keyboard input method is used to enter texts similar to using a Perkins style braille keyboard. This works by simultaneously pressing the keys that represent the 6 or 8 dots of a braille character (see Braille tables – Inherent braille properties).

To place a text label with braille keyboard input, first select ‘Add text label’ from the drawing tools toolbar and choose ‘Text and position: braille keyboard input’ from the properties toolbar or context menu. Next, click on the position in the design where you wish to place the text in braille. You can now type your text directly in your design.

‘Text label: braille keyboard input’ icon: Icon for braille keyboard input

Entering braille text

When entering the braille text, the letter keys f, d and s correspond to braille dots 1, 2 and 3 respectively; keys j, k and l with dots 4, 5 and 6. Keys a and ; can be used to type dots 7 and 8 when using 8-dot braille. The space bar is used for spaces in braille text as well.

Overview of the keyboard keys used for 6-dot or 8-dot braille input

Figure 1. Overview of which letter keys correspond with the dots in a braille character.

To enter a character, press all letter keys simultaneously, then release them at the same time. For example, to enter the letter n in braille containing dots 1345, press f, s, j and k.

The typed text will appear as black braille characters on screen, but without the visual text characters that are shown for text labels with computer keyboard input. The orange dot in front of the text label signifies that the braille keyboard was used as input.

Once the text label is placed in the design, it cannot be converted to another input method.

7.07 Editing text labels (braille)

Any text label placed in the design can still be edited later on. You can change the contents of the label or adjust the size and position in the design.
Please note that labels may only be edited according to the input method used to create them. For example, a text label entered via braille (six-key) input may only be edited using six-key, and a raised print character label may only be edited as a raised print character label. Labels cannot be converted from one type of label to another.

For more details on placing and aligning a text label in the design, see: Add text label or Braille grid (text alignment).

Editing text label content
Text labels may only be edited using the same entry method with which they were created (computer keyboard entry or braille keyboard entry). To edit the content of the computer keyboard entry text label, double-click the label to place the cursor in the text and edit the content as desired directly in the design area. When this edit mode is active, you can drag with the mouse across the text or use the Shift key combined with the Home, End or arrow keys to make a text selection.
You can also right-click the label and choose ‘Text and position: computer keyboard input’ or click on the corresponding icon in the toolbar to bring up a text and position dialog. Make the desired changes and choose ‘OK’ to update the text in the label.

To edit the contents of a braille keyboard (six-key) entry label, double-click on the label to edit it directly in the design. Alternatively, you can right-click and choose ‘Text and position: braille keyboard input’ to bring up the text and position dialog. Edit the label content as desired using six-key entry. When you are finished, deselect the label when editing in the design or choose ‘OK’ to close the dialog and update the label.

Editing the contents of a text label in the edit mode on screen

Figure 1. Double click on a text label for direct editing.

Adjusting word wrap length
Word wrap length is the maximum number of characters per line of text in a text label. For example, a word wrap length of 10 will divide a text of 25 braille characters into three lines of text. Line breaks will be placed at the position of spaces to avoid breaking up words. The lines of braille text have a fixed height that matches the standardised height of embossed braille text.
The word wrap length can be adjusted by dragging the sides of a text label. The tooltip will display the value of the word wrap length. Alternatively, select ‘Text and position’ from the properties toolbar or context menu of the selected text label to enter a value for the word wrap length.

With the alignment frame enabled, the word wrap length will only be automatically be adjusted when placing a new label. If the label should fit within the limits of the alignment frame once placed in the design, the wrap length will have to be changed manually in the design or via the option ‘Automatically adjust word wrap length’ in the ‘Text and position’ dialog.

Adjusting word wrap length by dragging the sides of the text label

Figure 3. Adjusting the word wrap size by dragging the sides of the text label; the tooltip signifies the word wrap length.

Text label presentation on screen
The braille component of text labels can be hidden on screen for better readability. To view only the text of the labels in your document, select a text label and choose ‘Hide braille dots on screen’ from the properties toolbar. This setting will be applied to all text labels in the document. Choose ‘Show braille dots on screen’ to show braille on screen again.
For a complete list of settings for the way text labels are displayed on screen, select ‘Text label presentation: on screen’ either from the properties toolbar of a selected text label, or from the Settings menu. You can adjust the font colour, enable enlarged text for selected text labels and hide the text or braille component of text labels.

Note: Braille dots for text labels can be disabled on print seperately via ‘Text label presentation: on print’.

‘Text label presentation on screen’ icon: Icon for Text label presentation: on screen
‘Show/Hide braille dots on screen’ icons: Icon for Show braille dots on screen Icon for Hide braille dots on screen
Additional line spacing
You can choose to use extra line spacing between lines of text throughout the document. For example, a value of 0.5 will add an empty space of half the height of a braille character between two lines of text.
This can be selected by choosing ‘Additional line spacing’ from the properties toolbar or context menu of a selected text label.

Cutting, copying, pasting and deleting labels (all label types)
The fastest way to copy, cut, paste or delete a label is using hotkeys. To cut a label, select it and press CTRL+X on the keyboard. Cutting the label removes it from the file but stores it on the clipboard allowing you to paste it elsewhere in the file. The cut label can only be pasted until you cut or copy a different label or object.
To copy a label, select it and press CTRL+C. Copying leaves the original label but keeps a copy of it that you can paste somewhere else in the file. To paste a cut or copied label, press CTRL+V. To delete a selected label, press the Delete key on the keyboard.

Moving labels (all label types)
Once your label is selected, you can move it by clicking the center and dragging it to a new position. A four pointed arrow cursor indicates you can move the label.
You can also easily move the label to the center of the design area by right-clicking it and selecting Center from the context menu. You can move it only horizontally or only vertically by right-clicking it, selecting ‘Move the label or object only horizontally or vertically’ and then dragging it up or down to move it vertically without changing its horizontal position, or left or right to move it horizontally without changing its vertical position.

Moving a text label

Figure 3. The cursor with four arrows indicates the text label will be moved when dragged.

‘Centre text label’ icon: Centre text label icon
‘Move horizontally/vertically’ icon: Move horizontally or vertically icon

Resizing labels (mammoth braille labels and raised print character labels only)
You can resize a mammoth braille label in one of two ways. The first way is to scale a mammoth braille label manually. To do this, select it, then click a purple marker in one of the corners of the label and drag it diagonally until the label is the desired size. This resizes the mammoth braille inside the label to fit the new label size. The other way to resize a mammoth braille label is to right-click it and choose ‘Braille dot size’, which brings up a dialog on which you can specify the size of the mammoth braille relative to standard braille as a percentage. The default percentage is 300, which means the mammoth braille is three times larger than standard braille. Enter the desired size of the mammoth braille and choose OK to close the dialog, adjust the mammoth braille size and automatically resize the label to fit the new size of the mammoth braille.

Raised print character labels may also be resized in one of two ways. The first way is the same as for mammoth braille labels; select the raised print character label, then click a purple square in one of the corners of the label and drag it diagonally until the label is the desired size. This resizes the raised print characters inside the label. The other way is to right-click the raised print character label and choose ‘Font type’ and size from the context menu. This launches a dialog that allows you to choose any font on your computer for the label, to specify any available font style for that font and to define the desired font size. Once you have finished making selections, choose OK on this dialog to apply your choices to the label text. The raised print character label will be resized to fit the new size of the text.

NOTE:
Because braille characters have a fixed size, text labels created using either computer keyboard entry or braille keyboard entry may not be resized. However, you can determine the width of the text by adjusting the word wrap length of the text label. Read more >

Resize mammoth braille using the purple markers

Figure 4. Mammoth braille or letters and digits can be resized using the purple markers.

Rotating labels (all label types)
To rotate a label, right-click it and then choose ‘Rotation’ from the context menu or click the icon in the toolbar of the selected label. On the dialog that appears, enter the desired angle of rotation in degrees and choose OK to rotate the label. You can also use SHIFT+scroll wheel on a mouse to rotate a selected label.

Please keep in mind that embossers that print in a fixed grid of braille dots are not suitable for printing braille characters at an angle.

‘Rotation’ icon: Rotation icon:
Editing letters and digits
To edit the content of a raised print character label, simply double click on it to open the edit dialog. Alternatively, choose ‘Text and position’ from the context menu or properties toolbar. Edit the label content as desired, then choose ‘OK’ to close the dialog and update the text.
 
Editing mammoth braille
To edit the content of a mammoth braille label, simply double click on it to open the edit dialog. Alternatively, choose ‘Text and position’ from the context menu or properties toolbar. Edit the label content as desired, then choose ‘OK’ to close the dialog and update the mammoth braille label.

8.01 Introduction on mathematical notations

Equations for sighted users are usually written in a spatial arrangement, in such a way that the components and their relations can be understood from their relative positioning. For example, a division is depicted by placing the dividend above the divisor, separated by a horizontal division line.

For printing in braille, this spatial arrangement has to be converted into a continuous line of braille characters. Mathematical symbols such as (large) brackets, square roots and many other non-day-to-day symbols have to be converted as well.

Mathematical notations and braille tables

Since computers began to play a role in math and science, it has become even more a necessity to find an unambiguous way of presenting the results (in braille as well). Many of the equation editors use MathML as their universal language to store and manipulate mathematical equations. This language is also used to add equations to your design in TactileView.

In order to get the correct equation printed in braille, a 2-step conversion is required: applying mathematical notation rules and applying a braille table to translate the characters into the corresponding braille dots.

Conversion from equation in MathType

Figure 1. Conversion from an equation in MathType to a mathematical text label in TactileView, by applying the chosen mathematical notation (in this case LaTeX) and braille table (en-us-comp8.ctb).

A math notation applies a set of rules that convert the spatial elements from the graphical lay-out (MathML) into a continuous line of text. Extra characters need to be inserted to indicate the relationship of the parts, to depict special mathematical symbols or to signify the logical order of the elements. Amongst other, the Nemeth, Unified English Braille, LaTeX, Marburg and Dedicon are some of the better known math notations and are available in TactileView.

The result of the first conversion step is that the equation has become readable as text in a linear instead of a spatial arrangement. During the second step, a ‘braille translator’ (in TactileView, the open source project LibLouis is used) applies the desired braille table to convert the linear text of the equation into the corresponding braille characters.

Keyboard entry of mathematical formulas

When entering a mathematical formula in TactileView, it is important to use the correct syntax for text-only mathematical notation on a computer. The spatial arrangement of the elements in a mathematical expression has to be entered using a combination of specific symbols and applying parenthesis where necessary. The list below gives an overview of which mathematical elements are supported for use in formulas in TactileView. The examples show how to apply and combine these elements.

Mathematical element or function Symbol Example
Separation between multiple formulas ; y=
Formula parameter x y=x
Operators
Addition + y=x+1
Subtraction - y=x-3
Multiplication * y=2*x
Division / y=x/3
Exponentiation ^ y=2^x
Parentheses ( ) y= (x+2)/(x-3)
Functions
Absolute value abs( ) y=abs(x+2)
Square root sqrt( ) y=sqrt(2*x)
Natural logarithm with base e ln( ) y=ln(x-1)
Logarithm with base 10 log( ) y=log(x+1)
Exponent with base e exp( ) y=exp(x^2-2*x)
Sine sin( ) sin(2*x)
Cosine cos( ) cos(2*x)
Tangent tan( ) tan(2*x)
Arcsine, arccosine or arctangent asin( ), acos( ), atan( ) y=asin(x-1)
Hyperbolic sine, cosine or tangent sinh( ),cosh( ),tanh( ) y=sinh(x-1)
Hyperbolic arcsine,arccosine or arctangent asinh( ),acosh( ),atanh( ) y=asinh(x-1)
Constants
Decimal sign . y=1.5*x
Natural logarithm base e y=e^(x^2-2*x)
Pi pi y=sin(2*pi*x)
Phi (golden ratio) phi y=2*phi*x
Derivatives
First derivative ' y=(x^2-3*x+4)'
Second derivative and higher multiple ' y=(sin(2*x+1))"

8.02 Text label – Math input (equation in braille)

Currently, there are three options for entering a mathematical text label in your TactileView design:

  1. Enter the equation in a regular text label, using the corresponding braille table;
  2. Use six-key entry (braille keyboard) to directly enter the math in braille;
  3. Enter the mathematical expression using a math editor (MathType).

Options 1 and 2 require knowledge about the mathematical braille notation you are using in order to enter the equation correctly. Option 3 allows you to enter math and convert it automatically to the desired notation in braille, but this requires MathType as a math editor. In the upcoming service release, a fourth method will be included, which allows you to enter the equation in linear notation and have it converted automatically (i.e. this will not require knowledge of the braille notation or a mathematical editor).

1. Using a regular text label

When you know the rules of the mathematical braille notation you wish to use, you can use a regular text label to enter it in your design. Select ‘Add text label’ from the drawing tools icon bar, then select ‘Text and position: computer keyboard input’ from the properties toolbar. Click in the design where you want to place the equation. Make sure to include the correct spaces, parentheses and other specific aspects of the mathematical notation. MathType is required when you wish to use symbols that are not on your keyboard.

Next, make sure to select the correct braille table for the notation you are using. You can select the braille table by choosing ‘Select braille table’ from the properties toolbar or context menu. The following braille tables are recommended for the different mathematical notations:

  • nemeth.ctb for Nemeth;
  • ukmaths.ctb for UKmaths;
  • marburg.ctb for Marburg notation;
  • en-us-comp8.ctb or similar for LaTeX;
  • Dutch braille table for Dedicon notation.

‘Add text label’ icon: Icon for placing a text label
‘Computer keyboard input’ icon: Icon for computer keyboard input
‘Select braille table’ icon: Select braille table icon

2. Using six-key entry

If you know the mathematical braille code and wish to simply use braille keyboard (six-key) entry for direct input of the desired characters, please refer to the ‘Different types of text labels‘ section for instructions on adding text labels through six-key entry.


‘Braille keyboard input’ icon: Icon for braille keyboard input

3. Equation with math editor (MathType)

You can use MathType as a math editor to automatically convert the entered equation to the desired braille notation. The math editor is also required to enter math that is too complex to be entered in linear format or when symbols are required that are not available on the keyboard. For more information on using MathType to enter mathematical expressions, please visit their website.

Once you have entered the equation in MathType, select it and copy it to the clipboard (Ctrl+C). Switch to TactileView, select ‘Add text label’ and choose ‘Text and position: math input’ from the properties toolbar. Click in the design where you wish to position your mathematical label.

In the dialog that appears, select the preferred mathematical notation and click on ‘Paste math equation from clipboard’. The equation will now be displayed in both visual (linear and spatial) and braille format.

The dialog also allows you to adjust the location in which you would like to insert the label (if different than where you originally clicked in the file) by filling in the distance fields. You can size the label by specifying the maximum number of characters you would like it to have before the text wraps to the next line. Choose ‘OK’ to confirm and close the dialog.

Mathematical text labels may be moved and edited the same as other text labels. For more information, please refer to the ‘Editing text labels‘ section.


‘Math input’ icon: Icon for math input

Mathematical text label in a TactileView design

Figure 1. A mathematical equation in TactileView; LaTeX and en-us-comp8.ctb were used as mathematical notation and braille table.

8.03 Graph properties for best tactile usability

When it comes to tactile graphs, there are several properties that together determine the tactile usability. The three elements in a graph (the equation in braille, grid paper with coordinate system and the curve of the formula) can be configured individually to achieve the optimal tactile result. Personal preferences of the VIP reader as well as the properties of the printer that will be used both need to be taken into account. Therefore we advise you to test the settings described below first to find what works best for you.

Choosing the best graph properties

The mathematical formula(s) and range of the axes are generally the most important elements when you create a new graph. All other aspects of the grid are for tactile presentation purposes. Reading a tactile graph can be complex enough on its own, so choosing the optimal settings for your production method (swellpaper or the type of braille embosser) is important. This works best if you can imagine the result of each setting in advance. The list below gives an overview of all the settings that are related to a tactile graph.

Graph properties

  1. Coordinate system and grid paper

The coordinate system (the axes of the graph) and grid paper (the regular grid that indicates the values of the graph) form the frame in which the graph will be plotted.
Select ‘Positions and appearance’ from the properties toolbar or context menu of the graph to access the ‘Appearance’ settings for the coordinate system and grid paper.

Coordinate system – X and Y axis

– Line thickness of the axis; thicker axis lines can be used to distinguish the axes more easily from the thinner grid lines, but also take up more space and tear more easily on some embossers.

Grid paper

– Draw border to surround the axis; this places a rectangular frame around the entire grid.

– Style of auxiliary lines for grid boxes; you can choose from: line, cross, dot, dash and none.

– Thickness of the auxiliary lines for grid boxes; use thinner lines to make the grid boxes less prominent for better contrast with the formula lines.

– Relief height of auxiliary lines for grid boxes; you can make the grid lines less prominent and more easily distinguished from the axes and formulas by lowering the line height. This is only available for embossers that support variable dot height.


The axes are thicker than the grid box lines for easy distinction.

Figure 1. Differences in line thickness are used for easy tactile distinction between the grid boxes and axes.

The ends of the graph are indicated by the bounding border

Figure 2. A border is used around the edges of the graph.

Four different grid box styles: lines, dashed lines, crosses and dots

Figure 3. Four different grid box styles: line, dash, cross and dot.

A lower relief height can be used for the grid boxes when supported by the embosser.

Figure 4. A lower line height, indicated with a lighter blue colour, can be used for easy distinction of the grid boxes.

  1. X and Y axes

These settings can be adjusted separately for the horizontal (X) and vertical (Y) axis.

– Extreme values for the axis; this determines the range in which the graph is shown.

– Subdivision of the axis: units per grid box and units per tick; you can choose the interval that is used for the grid boxes and ticks along the axis to easily read the values of the graph.

– Ticks per text label; you can choose whether a numeric value should be placed at each tick, more spaced out (e.g. 1 text label for every 2 ticks) or only at the origin/ends.

– Number of decimals of the values along the axis; some graphs might require more decimal numbers.

– Position of the labels relative to the graph’s border; this allows you to create enough space between the grid and value labels along the axis. In the design, you can also drag the purple marker below or left of the values to move them to the required position with the mouse.

– Name for the axis; by default, these are ‘x’ and ‘y’, but you can change this to suit the graph (e.g. ‘Number purchased’ and ‘Price’).

– Horizontal and vertical position of the axis name; these determine the position of the axis name label. In the design, you can drag this label to the required position with the mouse. Double click on a formula label to edit it.

– A thickness of the axes of 0 pixels allows you to produce a formula line without any coordinate system, when only the shape of the mathematical function is important without the corresponding values. For this application, it is best to disable the grid boxes and the border surrounding the graph.


The range for the axes and positions of the ticks, grid boxes and value labels determines the layout of the axes of the graph

Figure 5. The range for the axes and positions of the ticks, grid boxes and value labels determines the layout of the axes of the graph

The axes can be labeled, such as 'Quantity' and 'Price in euro'

Figure 6. The axes can be labeled individually (X and Y are the default labels).

Graph without coordinate system, showing only the formula lines

Figure 7. A graph using a thickness of 0 pixels for the axes shows only the formula lines.

  1. Formula lines

The settings for each formula line that is presented in the graph can be adjusted separately.

– Formula syntax; enter the mathematical equation that will be plotted.

– Text label representation of the formula; the legend above the graph shows which formulas are presented. You can choose from an number of mathematical representations; alternatively, you can choose to enter your own name (e.g. ‘Surface area’) or choose not to include a label.

– Line style for the formula; by default, each formula gets a different tactile line style to distinguish multiple formulas in a graph. This line style is also presented in the formula legend above the graph. Different colours are used on screen for easy visual recognition.

– Position of the text label; by default, the text labels for the formulas are placed above the graph. In the design, you can also move these with the mouse.


Different line styles are used for the formulas in the graph, as signified in the fomula legend.

Figure 8. Different line styles are used for the formulas in the graph, as signified in the fomula legend. Different colours are used on screen to easyly distinguish the formulas visually.

8.04 Creating a graph

TactileView offers a very powerful graphing feature, which allows you to enter formulas and have them graphed over a specified range. TactileView gives you precise control over the styles used in your graph for the functions, axes, gridlines, labels and more. You can also move and resize your graph like any other drawing object.

There are several possible approaches of creating a new graph. You can choose an empty grid as a basis (see paragraph 1), select one of the TactileView graph examples and adapt it to form your own (see paragraphs 2 and 3), or create a new graph based on the entered formula (see paragraphs 4 and 5). You can also save any graph as ‘MyGrid’ for reuse in later designs (see section ‘Save graph as MyGrid for later use’).

You can read an overview of all the tactile properties that determine the tactile usability of a graph in the ‘Graph properties’ section. For more information on the different mathematical notations in braille, read the ‘Introduction on mathematical notations‘ section.

1. Coordinate system (no functions)

To enter an empty coordinate system (empty grid paper without any graphed formulas), select ‘Draw graph’ from the drawing tools icon bar, then choose ‘Coordinate system (no functions)’ from the properties toolbar. This option can also be found in the Graphs menu.

Once this option is selected, an empty grid will appear in the design. By default, this grid is square and ranges from -4 to 4 on both the x- and y-axis, with straight grid lines at an interval of 1 unit. You can use the options in the properties toolbar or context menu to adjust the properties of the grid or add a graphed formula.


Coordinate system (no functions) icon: Coordinate system (no functions) icon

Empty grid ranging from -4 to 4 along both axes.

Figure 1. Empty grid inserted in a TactileView design.

2. Functions and formulas (examples)

TactileView includes two sets of ready to use example grids. These have already been optimized to depict the selected formula. You can use these graphs as a basis for your own by simply changing the formula(s).

Select ‘Draw graph’ from the drawing tools icon bar, then choose ‘Functions and formulas (examples)’ from the properties toolbar. Alternatively, this option can also be found in the Graphs menu.

In the dialog that appears you will find a list of sample graphs which each include one formula, ranging from simple to more complex. By choosing ‘Change formula’, you can edit the formula to create your own graph based on the sample. ‘Change coordinate system’ allows you to adjust the settings for the grid style and properties of the axes (such as the range). Use ‘Multiple formulas’ to add extra formulas to the grid (for more information on including multiple formulas in one grid, read the ‘Graphing multiple lines’ section).

Once you have selected a sample graph or when you are satisfied with the adjustments, you can choose to insert the graph a blank new document (click ‘Save in new document’) or place it in the currently active document (click ‘Save in current document’). You can also choose to replace the most recent grid in the current document (click ‘Replace the last grid’).


‘Functions and formulas (examples)’ icon: Functions and formulas (examples) icon

Functions and formulas dialog

Figure 2. ‘Functions and formulas (examples)’ dialog; click on the image to enlarge.

3. Grids and graphs (advanced examples)

Similar to ‘Functions and formulas’, the ‘Grids and graphs’ dialog contains a list of sample grids that can be used as is, or adapted to create your own grids. The list contains a number of variations of empty grids, as well as a list of grids that contain one or more formulas (arranged from simple to more complex). These examples are labelled as numbered TVGrids. Below these TVGrids, you will find any grids that were saved for reuse as MyGrids.

You can access this list of sample grids by selecting ‘Draw graph’ from the drawing tools icon bar, then choosing ‘Grids and graphs (advanced examples)’ from the properties toolbar. Alternatively, this option can also be found in the Graphs menu.

The list of properties of the selected sample graph is shown in the second list box. If you wish to adjust any of the settings, select it from this list and click ‘Change properties’.

If you have selected one of the MyGrids from the list, you have the option to remove it from the list of saved grids. When you have adjusted the selected MyGrid, you have the option to either save it as a new MyGrid or replace the edited MyGrid.

Once you have selected a sample graph, MyGrid or when you are satisfied with the adjustments, you can choose to insert the graph a blank new document (click ‘Save in new document’) or place it in the currently active document (click ‘Save in current document’). You can also choose to replace the most recent grid in the current document (click ‘Replace the last grid’).


‘Grids and graphs (advanced examples)’ icon: Grids and graphs (advanced examples) icon

Grids and graphs dialog

Figure 3. ‘Grids and graphs (advanced examples)’ dialog; click on the image to enlarge.

4. Add custom graph: equation editor

This option allows you to create a graph based on a formula that is entered using MathType as an equation editor. The math editor is also required to enter math that is too complex to be entered in linear format or when symbols are required that are not available on the keyboard. For more information on using MathType to enter mathematical expressions, please visit their website.

Once you have entered the equation in MathType, select it and copy it to the clipboard (Ctrl+C). Make sure that the entered formula is suitable for conversion to a graph. Next, switch to TactileView and select ‘Draw graph’ from the drawing tools icon bar, then choose ‘Add custom graph: equation editor’ from the properties toolbar. Alternatively, this option can also be found in the Graphs menu.

In the dialog that appears, select the preferred mathematical notation and click on ‘Paste math equation from clipboard’. The equation will now be displayed in both visual (linear and spatial) and braille format. Choose ‘OK’ to confirm.

In the formula dialog that appears, the options below the formula as well as the buttons ‘Positions and appearance’, ‘Horizontal (x) axis’ and ‘Vertical (y) axis’ allow you to adjust all the grid properties, formula labels, line style and axis properties; you can read an overview in the ‘Graph properties’ section. Use the ‘Apply’ button to refresh the graph preview after you have made any changes to the graph.

Once you are satisfied with the composed graph, select ‘OK’ to close the dialog and insert the graph in the design.


‘Add custom graph: equation editor’ icon: Add custom graph: equation editor icon

Add custom graph: equation editor dialog

Figure 4. ‘Add custom graph: keyboard input’ dialog; click on the image to enlarge.

5. Add custom graph: keyboard input

When you activate ‘Add custom graph: keyboard input’ from the Graphs menu or from the properties toolbar of ‘Draw graph’, a formula dialog will open. Enter the formula in the first entry field, making sure to use the correct syntax (e.g. 2*x instead of 2x, x^2 for x squared, etc.) similar to entering an equation in software such as Microsoft Excel. You can also select elements from the list of available functions and constants and insert them into the formula by double clicking on it or pressing the Enter key.

Once again, the options below the formula as well as the buttons ‘Positions and appearance’, ‘Horizontal (x) axis’ and ‘Vertical (y) axis’ allow you to adjust all the grid properties, formula labels, line style and axis properties; you can read an overview in the ‘Graph properties’ section. Use the ‘Apply’ button to refresh the graph preview after you have made any changes to the graph.

Once you are satisfied with the composed graph, select ‘OK’ to close the dialog and insert the graph in the design.


‘Add custom graph: keyboard input’ icon: Add custom graph: keyboard input icon

Add custom graph: keyboard input dialog

Figure 5. ‘Add custom graph: keyboard input’ dialog; click on the image to enlarge.

8.05 Graphing multiple lines

TactileView provides the ability to graph four or more formulas at the same time. In the ‘Creating a graph‘ section you can read how to prepare a graph with a single formula, to which you can add additional formulas as described below.

Adding a formula

Select the graph in your design to which you wish to add a formula. Similar to creating a new graph, when adding a formula you need to choose which input method you want to use: you can either enter the formula with MathType as an equation editor, or use the keyboard to enter the formula. From the properties toolbar or context menu of the selected graph, choose ‘Add function: keyboard input’ or ‘Add function: equation editor’. In the dialog that appears, you can enter your new formula in the same way as when you created the graph.

Notice that by default a dashed line style is selected to distinguish the different formulas from each other, but you can change this to Line, Dot or Long/Short Broken if you wish. It is recommended to choose a different line style for each formula you enter. The legend above the graph shows which formula corresponds with which line style. On screen, four different colours are used to easily distinguish between the formulas.

You can apply any changes in the graph preview on the right side of the dialog at any time by choosing the ‘Apply’ button. When you are satisfied with the selected options for the new formula dialog, choose the ‘OK’ button to save your changes, close the dialog and update your graph. In the properties toolbar you will see that the icon for ‘Formula 2’ is no longer greyed out, indicating that a second formula is present in the graph.

You can add a third or fourth formula by following this same process after selecting the graph and choosing ‘Add function: keyboard input’ or ‘Add function: equation editor’ from the properties toolbar or context menu. If you wish to include more than four formulas, you will need to add the remaining formulas to one of the first four, seperated by a semicolon: e.g. sin(x^2);cos(x^2). These will be plotted as seperate lines, but with the same line style and other properties.


‘Add function: keyboard input’ icon: Add function: keyboard input icon
‘Add function: equation editor’ icon: Add function: equation editor icon
‘Formula 1-4’ icons: Formula 1 to 4 icons

Different line styles such as dashed or dotted lines are used to distinguish different formulas in a graph.

Figure 1. Different line styles, such as dashed or dotted lines, are used to distinguish different formulas in a graph; on screen, colours are used to signify these differences.